The monsoon, which accounts for about 70% of India’s annual rainfall, is vital for the $300 billion farm economy and has an outsized influence on food prices, rural demand and broader economic output El NINO and LA NINA UPSC Notes: Meaning, Impact and Important Terms
 "weak monsoon, el nino")
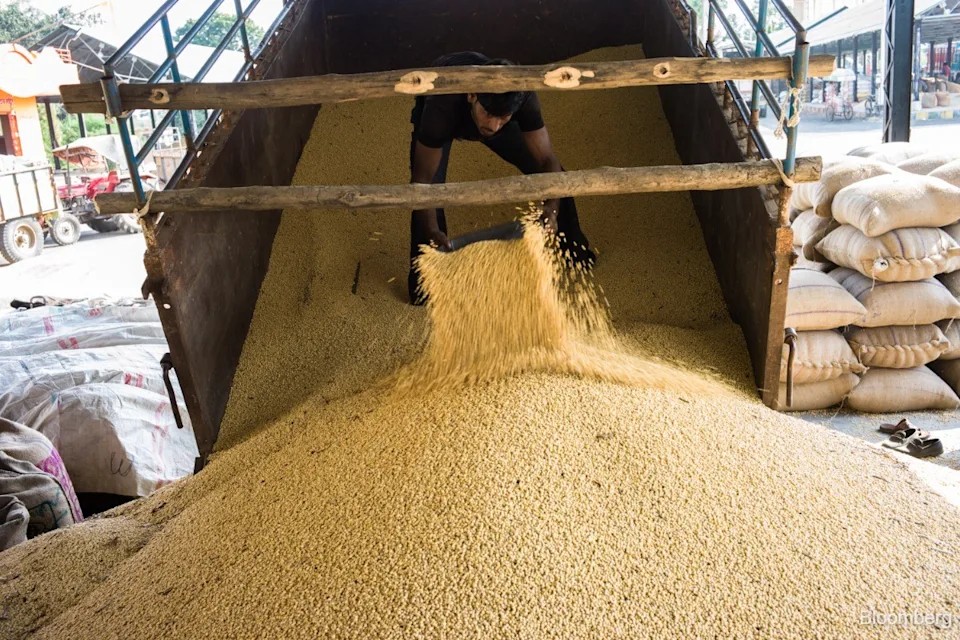
Farmers sow rice saplings at a paddy field in Sonipat, Haryana weak monsoon is emerging as India’s next inflation risk, with a developing El Niño threatening to curb rainfall and push up food prices just as an easing oil relieves broader price pressures.
The southwest monsoon, which accounts for about 70% of India’s annual rainfall, is vital for the $300 billion farm economy and has an outsized influence on food prices, rural demand and broader economic output.
“Bad rains bring bad sentiment, both in equity markets and rural spending,” said Rajni Thakur, an economist at L&T Finance Ltd., which runs a rural loan book of over 450 billion rupees ($4.8 billion). “First comes inflation, then sentiment is hit, which leads to a cut in spending during the festive season.” Reserve Bank of India officials have said they are closely monitoring the weather to assess the inflation outlook and stand ready to respond if price pressures broaden. The RBI left its key rate at 5.25% this month while maintaining a neutral stance with inflation comfortably within its 2-6% target range.
)
A weak monsoon severely impacts India’s economy by triggering high food inflation, lower rural demand, and increased fiscal pressure. Because nearly half of India’s farmland lacks irrigation, erratic rainfall directly cuts crop yields, drives up essential food prices, and forces the government to spend more on subsidies.
1. Identify Direct Economic Transmission Channels
- Agricultural Output Drops: Lower production of kharif crops like rice, pulses, and oilseeds.
- Food Inflation Spikes: Prices for daily essentials surge rapidly.
- Rural Demand Weakens: Lower farm incomes reduce spending on consumer goods and tractors.
- Water Reservoirs Deplete: Low water levels hurt winter crops (rabi) and power generation.
El Nino and La Nina are two of the most powerful natural climate phenomena that influence weather patterns across the globe. For India, these oceanic events directly impact the monsoon season, agricultural productivity, and economic growth.
Understanding these climate patterns is essential for UPSC aspirants, particularly for the Geography and Environment sections of GS Paper 1, as well as for linking concepts with current affairs and climate change initiatives.
What is El Nino?
El Nino is a climate phenomenon characterised by the warming of sea surface temperatures in the central and eastern equatorial Pacific Ocean. This warming disrupts normal weather patterns across the globe.
- EL Nino is also known as “The Little Boy” or “Christ Child” in Spanish.
- Occurs irregularly every three to seven years.
- Typically lasts between nine to eighteen months.
- Involves warming of ocean temperatures by at least 0.5°C above normal for five consecutive three-month periods.
- Associated with weakened trade winds in the Pacific Ocean.
- Peaks during the northern hemisphere winter (November to January).
- Generally brings below-normal rainfall to India during the monsoon season.
- It can cause droughts in Southeast Asia, Australia, and Indonesia.
- Often leads to increased rainfall in Peru, Ecuador, and the Southern United States.
What is La Nina?
La Nina is a climate phenomenon characterised by the cooling of sea surface temperatures in the central and eastern equatorial Pacific Ocean. It represents the opposite phase of El Nino.
- La Nina means “The Little Girl” in Spanish. It is also sometimes called “El Viejo” (the old man) or simply “a cold event.”
- Occurs every two to seven years, often following an El Nino event.
- It can last between one to three years, sometimes longer than El Niño.
- Involves cooling of ocean temperatures by at least 0.5°C below normal for five consecutive three-month periods.
- Associated with stronger-than-normal trade winds across the Pacific Ocean.
- Results in increased upwelling of cold, nutrient-rich water along South America’s coast.
- Generally brings above-normal rainfall to India during the monsoon season.
- It can cause heavy rainfall and flooding in Southeast Asia and Australia.
- Often leads to drought conditions in Peru and Ecuador
What is ENSO (El Nino-Southern Oscillation)?
The El Nino-Southern Oscillation (ENSO) is a recurring natural climate phenomenon that involves fluctuating ocean temperatures and atmospheric pressure patterns across the equatorial Pacific Ocean.
- ENSO has two oceanic components: El Nino (warm phase) and La Nina (cold phase).
- The Southern Oscillation is the atmospheric counterpart that couples with ocean temperature changes.
- ENSO is one of the most important drivers of global climate variability
- It affects weather patterns across the globe through atmospheric teleconnections.
- ENSO cycles are not perfectly regular but show some pattern over the years.
Climate Patterns: Normal, El Nino, and La Nina Phases
Understanding the three phases of ENSO is essential for comprehending how these phenomena develop and impact global weather.
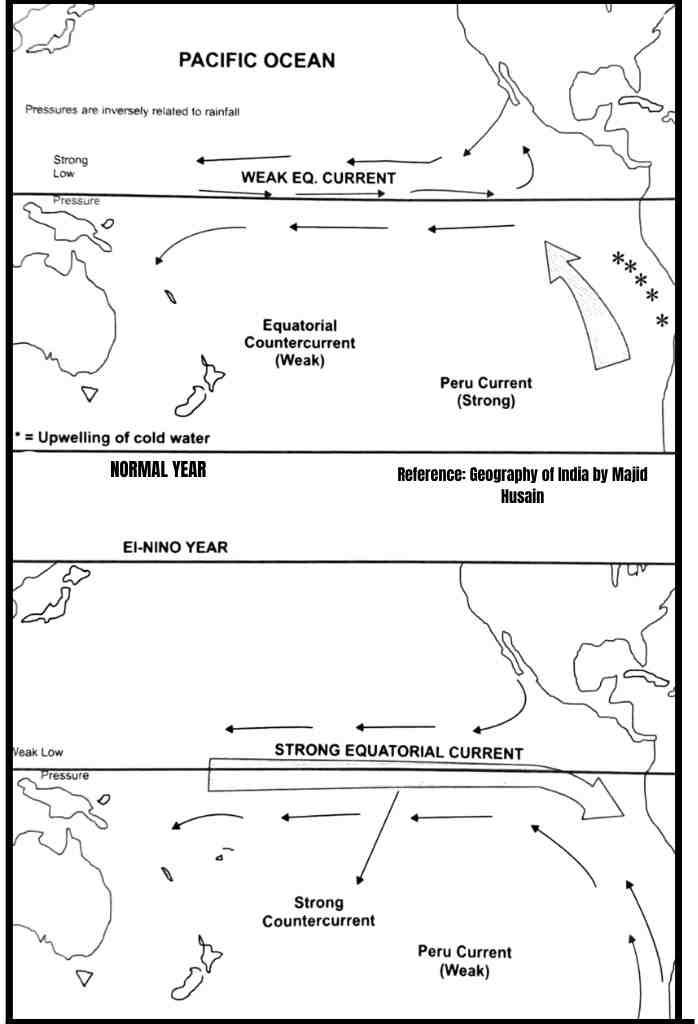
1. Normal Conditions (ENSO-Neutral Phase)
During normal or neutral conditions, the Pacific Ocean displays typical patterns of temperature distribution and wind circulation without significant anomalies. Key characteristics include:
- Trade winds blow steadily from east to west across the equatorial Pacific Ocean.
- Warm surface water is pushed toward the western Pacific near Indonesia and Australia.
- The sea level is approximately 0.5 meters higher in the western Pacific compared to the eastern Pacific.
- Cold, nutrient-rich water rises to the surface (upwelling) along the coast of South America.
- Walker Circulation operates normally with rising air in the western Pacific and descending air in the eastern Pacific.
- Sea surface temperatures are about 14°F (8°C) warmer in the western Pacific than in the eastern Pacific.
- The thermocline (boundary between warm surface water and cold deep water) is deeper in the west and shallower in the east.
- Normal monsoon patterns prevail across the Indian Ocean and Asia.
2. El Nino Phase (Warm Phase)
El Nino develops when trade winds weaken or even reverse, allowing warm water to spread eastward across the Pacific Ocean. Key characteristics include:
- Trade winds weaken significantly or may even reverse direction.
- Warm surface water that normally accumulates in the western Pacific flows eastward toward South America.
- Sea surface temperatures in the central and eastern Pacific Ocean rise by 1°C to 3°C above normal.
- The thermocline deepens in the eastern Pacific, reducing upwelling of cold water.
- Atmospheric pressure increases over Indonesia and Australia.
- Atmospheric pressure decreases over the eastern Pacific.
- The warm pool of water shifts from the western Pacific to the central and eastern Pacific.
- Convection and rainfall patterns shift eastward, bringing rain to normally dry regions of Peru and Ecuador.
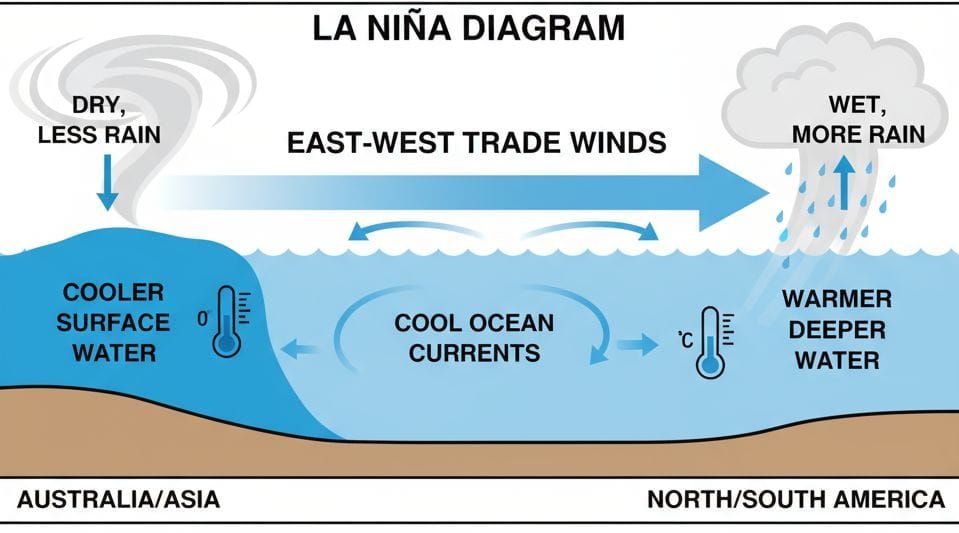
3. La Nina Phase (Cold Phase)
La Nina occurs when trade winds strengthen beyond normal levels, intensifying the typical Pacific Ocean circulation patterns. Key characteristics include:
- Trade winds strengthen significantly, becoming more powerful than normal.
- Enhanced westward movement of warm surface water toward Indonesia and Australia.
- Sea surface temperatures in the central and eastern Pacific Ocean fall by 1°C to 3°C below normal.
- Increased upwelling of cold, nutrient-rich water along the coast of South America.
- The thermocline becomes shallower in the eastern Pacific.
- Atmospheric pressure decreases over Indonesia and the western Pacific.
- Atmospheric pressure increases over the eastern Pacific.
- Enhanced convection and rainfall over the western Pacific and Southeast Asia
- The warm water pool in the western Pacific becomes warmer and deeper than normal.
What is the Impact of El Nino and La Nina on India?
Both El Nino and La Nina significantly affect India’s climate, agriculture, economy, and water resources. Let’s understand these impacts in detail.
Impact of El Nino on India
1. Monsoon and Rainfall:
- Weakens the southwest monsoon, leading to below-normal rainfall.
- Disrupts the normal east-to-west movement of moisture-laden winds.
- Causes the delayed onset of the monsoon season.
- Results in uneven distribution of rainfall across different regions.
- Historical droughts of 2002, 2009, 2014, and 2015 were all associated with El Nino years.
2. Agriculture:
- Reduces Kharif crop production, especially rice, pulses, maize, and oilseeds.
- Leads to low soil moisture levels and inadequate irrigation water.
- Causes crop stress, stunted growth, and poor yields.
- Worst-hit states include Punjab, Haryana, Uttar Pradesh, Bihar, Maharashtra, and Karnataka.
- Increases pest and disease proliferation due to favourable conditions
3. Temperature and Weather:
- Leads to higher-than-normal temperatures across India.
- Increases heat stress on crops and livestock.
- Creates drought-like conditions in many regions.
- It may reduce cyclonic storms in the Bay of Bengal.
Cyclones in India: Formation, Classification & Impact — UPSC Geography Cyclones are a key topic for the UPSC Civil Services Examination, covered under GS Paper 1 (Physical Geography) and GS Paper 3 (Disaster Management and Current Affairs). Questions often test your understanding of their formation (genesis), types, impacts on climate and human life, and mitigation measures.
Here, we’ll cover everything you need to know about Cyclones for UPSC, from their meaning and classification to their effects and disaster management strategies, strictly aligned with the UPSC syllabus.
What is a Cyclone?
A cyclone is a big storm with strong winds that move around a center of low pressure. It forms over warm ocean water and can bring heavy rain and strong winds. The word “cyclone” comes from the Greek word “Cyclos,” meaning the coils of a snake, and was coined by Henry Piddington because these storms appear like coiled serpents of the sea.
- Cyclones rotate counterclockwise in the Northern Hemisphere and clockwise in the Southern Hemisphere.
- They draw their energy from warm ocean waters, typically above 26 °C to 27 °C.
- The center of a cyclone, known as the “eye,” is typically calm with clear skies.
- They are known by different names in different regions – hurricanes in the Atlantic, typhoons in the Pacific, and cyclones in the Indian Ocean.
Classification of Cyclones
Cyclones are classified into different types based on their location, formation process, and characteristics.
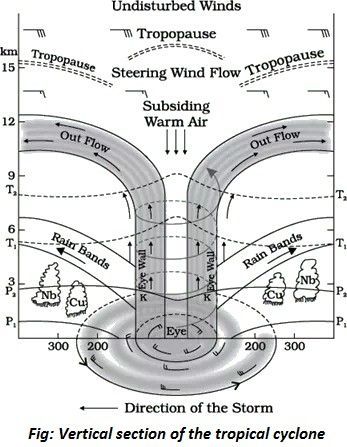
1. Tropical Cyclones
Tropical cyclones are the most destructive and well-known type of cyclones that form over warm tropical oceans between 5° and 30° latitude.
- Formation Zone: Between the Tropic of Cancer and the Tropic of Capricorn (5°-30° latitude).
- Temperature Requirement: Sea surface temperature above 26.5-27°C for at least 60m depth.
- Different Names: Called hurricanes (Atlantic), typhoons (Pacific), and cyclones (Indian Ocean).
- Peak Season: Late summer to early winter (August to mid-November).
- Direction: Counterclockwise in the Northern Hemisphere, clockwise in the Southern Hemisphere.
- Speed: Can travel 480-640 km per day, lasting about 4828 km before dissipating.
- Structure: Well-defined eye (calm center), eyewall (strongest winds), and spiral rainbands.
Essential Conditions for Formation of Tropical Cyclones:
- Warm ocean water (above 27°C) is a significant energy source.
- Presence of Coriolis force (minimum 5° from the equator).
- Low vertical wind shear to allow vertical cloud development.
- Pre-existing low-pressure disturbance.
- High humidity in the mid-troposphere (50-60%).
- Upper-level divergence for air to escape upward.
Stages of Development of a Tropical Cyclone:
There are three important stages of development of a tropical cyclone:
- Formation Stage: Transfer of water vapor and heat from the ocean to the atmosphere.
- Mature Stage: Development of the eye, eyewall, and organized spiral bands.
- Decay Stage: Weakening when moving over land or cold water.
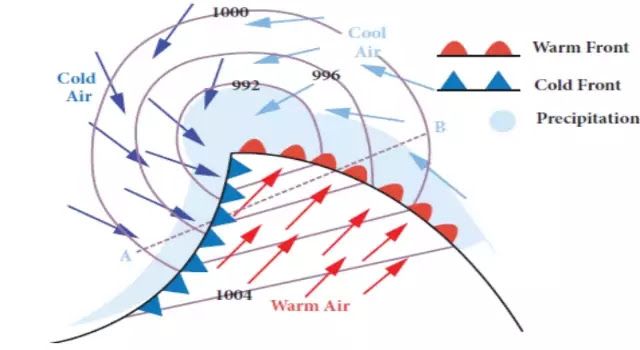
2. Extratropical Cyclones (Temperate Cyclones)
Also known as mid-latitude cyclones, temperate cyclones, or frontal cyclones, these form in middle latitudes between 30° and 65° latitude.
- Formation Zone: Between 30°-65° latitude in both hemispheres.
- Theory: Explained by Polar Front Theory by Bjerknes (1918).
- Movement: West to east direction, more pronounced in winter.
- Duration: Individual cyclones last 3-10 days.
- Size: Covers larger areas than tropical cyclones.
- Fronts: Associated with warm fronts, cold fronts, and occluded fronts.
Key Characteristics of Extratropical Cyclones:
- Lower wind speeds than tropical cyclones, but with steep temperature gradients.
- It can form over land and sea.
- Responsible for much of the severe winter weather.
- Example: Nor’easter storms affecting the US East Coast.
Formation Process (Polar Front Theory):
- Stage I (Frontogenesis): Warm and cold air masses meet along the polar front.
- Stage II (Cyclogenesis): Air masses push into each other, creating wave formation.
- Stage III (Mature Stage): Well-developed cyclone with distinct fronts.
- Stage IV (Occlusion): Cold front overtakes warm front, cyclone dissipates.
3. Polar Cyclones
Small but intense cyclones that form in polar regions, also called “Arctic hurricanes” or “polar lows”.
- Formation Zone: Above 60° latitude in polar regions (Arctic and Antarctic).
- Size: Much smaller than other cyclone types.
- Development Time: Forms rapidly, often in less than 24 hours.
- Energy Source: Heat transfer from water to air and latent heat release.
- Seasonality: Strongest during winter months.
- Movement: Contained within the jet stream in the Northern Hemisphere.
Impact of Polar Cyclones on Weather:
- Bring extreme cold temperatures to lower latitudes.
- It can cause “polar vortex” events affecting temperate regions.
- Create unseasonably cold conditions far from the poles.
- It can kill crops and cause energy crises.
4. Mesocyclones
Mesocyclones are small-scale rotating thunderstorms that can develop into tornadoes. These cyclones represent a transitional stage between thunderstorms and tornadoes.
- Scale: Much smaller than other cyclone types (storm-scale).
- Formation: Develops within severe thunderstorms.
- Rotation: Rotating air within a thunderstorm due to the Coriolis force.
- Tornado Connection: Can produce tornadoes when the cloud extends to the ground.
- Duration: Short-lived compared to larger cyclones.
Key Characteristics of Mesocyclones:
Contains rotating air along the vertical axis.
The most serious type of thunderstorm.
Produces large hailstorms and strong gusty winds.
It can cause significant destruction despite its small size.
Process of Formation of Cyclones
The formation of cyclones is a complex process that requires specific atmospheric and oceanic conditions. Understanding this process helps in predicting and preparing for these natural disasters.
1. Initial Heating and Low-Pressure Formation
- Warm ocean water (above 26-27°C) heats the air above it.
- The heated air becomes lighter and rises, creating a low-pressure area at the surface.
- Surrounding air rushes in to fill this void.
2. Air Circulation and Spin
- The Coriolis force, caused by Earth’s rotation, makes the incoming air spin.
- This creates a rotating system of winds around the low-pressure centre.
- The system spins counterclockwise in the Northern Hemisphere and clockwise in the Southern Hemisphere.
3. Moisture and Cloud Formation
- Rising warm air carries water vapour from the ocean surface.
- As this air rises higher, it cools and water vapour condenses into clouds.
- The condensation process releases latent heat, providing more energy to the system.
4. Intensification and Eye Formation
- The continuous cycle of heating, rising air, and condensation strengthens the system.
- As the system rotates faster, a calm central area called the “eye” forms.
- Strong winds develop around the eye, creating the eyewall.
- The storm system can now be classified as a cyclone.
Factors Affecting the Formation of Cyclones
Different environmental conditions affect whether a cyclone will form, grow stronger, or weaken. Its development depends on how various weather and ocean factors work together. Here are the key factors that affect the formation of cyclones:
- Sea surface temperature affects energy availability: warm waters above 26.5°C promote formation while cool waters inhibit development.
- Vertical wind shear controls storm organization: low shear allows development, while strong shear disrupts cyclone structure.
- Atmospheric moisture determines fuel supply: high humidity sustains cyclones while dry air intrusion weakens them.
- Upper-Level pressure systems influence ventilation: high pressure aloft enhances divergence while low pressure suppresses development.
- Climate patterns modulate seasonal activity: El Niño/La Niña cycles affect cyclone frequency and regional distribution.
- Ocean heat content impacts intensification potential: deeper warm layers support rapid strengthening.
- Environmental temperature gradients control atmospheric stability: strong gradients promote formation, while weak gradients inhibit development.
Cyclones in India
India has a long coastline of about 7,516 km, bordered by the Arabian Sea, Bay of Bengal, and the Indian Ocean. Because of this location, it is one of the most cyclone-prone countries in the world. Every year, India experiences two to three tropical cyclones on average.
1. Geographic Vulnerability
- India has 9 coastal states and 4 Union Territories affected by cyclones.
- 7,516 km coastline, with 5,400 km along the mainland, makes India highly exposed.
- Four states (Andhra Pradesh, Odisha, Tamil Nadu, and West Bengal) and one UT (Puducherry) are most vulnerable.
2. Cyclone Frequency and Distribution
- 2-3 tropical cyclones make landfall in India each year on average.
- The Bay of Bengal produces 4 times more cyclones than the Arabian Sea (ratio 4:1).
- The North Indian Ocean generates only 7% of the world’s cyclones, but causes disproportionate damage.
3. Most Vulnerable Regions
- East Coast (High Risk): Odisha (most affected), West Bengal, Andhra Pradesh, Tamil Nadu.
- West Coast (Moderate Risk): Gujarat, Maharashtra (Arabian Sea cyclones).
- Island Territories: Andaman & Nicobar Islands, Lakshadweep.
4. Bay of Bengal Dominance
- Higher sea surface temperatures (28-32°C) throughout the year.
- Funnel-like shape concentrates and amplifies storm surges.
- Warm river discharge from the Ganga, Brahmaputra maintains surface temperatures.
- Shallow coastal waters allow higher storm surge penetration inland.
5. Recent Major Cyclones in India
- Cyclone Fani (May 2019): Odisha
- Cyclone Amphan (May 2020): West Bengal and Odisha.
- Cyclone Nisarga (June 2020): Made landfall near Alibag, Maharashtra.
- Cyclone Yaas (May 2021): Landed in Odisha and West Bengal.
- Cyclone Tauktae (May 2021): Gujarat coast
- Cyclone Sitrang (Oct 2022): Struck West Bengal and Bangladesh.
- Cyclone Mocha (May 2023): One of the strongest Bay of Bengal storms with 215 kmph winds, affected Myanmar and Bangladesh.
- Cyclone Biparjoy (June 2023): along the Gujarat and Rajasthan coasts.
- Cyclone Remal (Oct 2024): Hit Andhra Pradesh and Odisha
- Cyclone Tej (Nov 2024): near Kalingapatnam, Andhra Pradesh
- Cyclone Hamoon (June 2025): Approached West Bengal and Odisha.
- Cyclone Shakti (October 2025): Along Maharashtra and Gujarat.
Early Warning System in India for Cyclones
- India Meteorological Department (IMD) monitors cyclones using satellite imagery, ocean buoys, and cyclone detection radars.
- Cyclone Warning Centers (CWCs) and Area Cyclone Warning Centers (ACWCs) issue warnings based on cyclone tracking.
- IMD follows a four-stage warning system: Pre-Cyclone Watch (72 hrs), Cyclone Alert (48 hrs), Cyclone Warning (24 hrs), and Landfall Outlook (12 hrs).
- The Bharat Forecast system helps in rapid and reliable communication of cyclone warnings to administration, fishermen, and coastal communities.
Difference Between Cyclones and Anticyclones
Cyclones and anticyclones are basic weather systems that affect the weather all around the world. Knowing the difference between them helps us understand how the weather changes and affects our daily lives.
| Cyclone | Anticyclone |
|---|---|
| Low pressure at the centre, high pressure surrounding. | High pressure at the centre, low pressure surrounding. |
| Air rises upward (convergence) | Air sinks downward (divergence) |
| Counterclockwise (anticlockwise) in the Northern Hemisphere | Clockwise in the Northern Hemisphere |
| Clockwise in the Southern Hemisphere. | Counterclockwise (anticlockwise)in the Southern Hemisphere. |
| High (50-250 km/hour) | Low (30-50 km/hour) |
| Stormy, cloudy, heavy rainfall, thunderstorms | Clear skies, calm, dry weather |
| Rising air cools and condenses, forming clouds | Descending air warms and dries, suppressing clouds |
| Heavy rainfall, storms | Little to no precipitation |
| Rapid temperature changes | Gradual temperature changes |
| Smaller diameter (200-2000 km) | Larger diameter (3000-8000 km) |
| Short-lived, moves fast | Long-lasting, moves slowly |
| Tropical and temperate regions | Subtropical and polar regions |
| Summer: Intense storms, heavy rain Winter: Snow, sleet, mixed precipitation | Summer: Hot, dry, clear skies, possible heat waves Winter: Cold, frost, fog formation |
Key Disaster Preparedness Strategies for Cyclones
Effective disaster resilience combines planning, infrastructure, community engagement, and ecosystem protection to reduce cyclone impacts and save lives.
- Develop and enforce cyclone-resilient building codes for homes, schools, and hospitals.
- Establish local early warning systems with clear evacuation protocols and communication in regional languages.
- Train and equip community volunteers as first responders for search, rescue, and relief operations.
- Integrate nature-based solutions like mangrove restoration and dune reinforcement to buffer storm surges.
- Create multi-hazard shelters and stock essential supplies (food, water, medicine) in cyclone-prone areas.
4. Economic Impact:
- Reduces agricultural output, leading to increased food prices and inflation.
- Affects GDP growth as agriculture contributes significantly to India’s economy.
- Increases rural poverty and distress among farmers.
- Impacts hydropower generation due to reduced water availability in reservoirs.
Impact of La Nina on India
1. Monsoon and Rainfall:
- Strengthens the southwest monsoon, leading to normal or above-normal rainfall.
- Enhances moisture convergence over the Indian subcontinent.
- Supports good agricultural productivity in most regions.
- It can cause excessive rainfall, leading to flooding in certain areas.
- Enhances the summer monsoon over Southeast Asia and the Indian subcontinent.
2. Agriculture:
- Boosts agricultural productivity, especially for rain-fed crops.
- Increases crop yields for Kharif season crops like rice, cotton, and sugarcane.
- Reduces dependency on irrigation systems.
- Lowers the need for food grain imports
- May damage crops like rice, sugarcane, and cotton in flood-affected areas.
- Beneficial for Northwest India and Bangladesh.
3. Temperature and Weather:
- Generally results in below-normal temperatures during the winter season.
- It can cause severe cold waves in northern India during winter.
- Increases cyclonic activity in the Bay of Bengal.
- It may pose threats to coastal infrastructure in states like Odisha, Andhra Pradesh, and Tamil Nadu.
- Brings enhanced rainfall during the post-monsoon season (October-November).
4. Economic Impact:
- Stabilises food prices due to increased agricultural output.
- Helps control inflation through abundant crop production.
- Boosts hydropower generation as reservoirs get replenished.
- Ensures sufficient groundwater recharge, benefiting water-scarce areas.
How El Nino and La Nina Impact the World
These climate phenomena affect weather patterns, agriculture, fisheries, and economies across the entire world.
Global Impact of El Nino
1. Regional Weather Impacts:
- South America: Heavy rainfall, flooding, and landslides in Peru and Ecuador; droughts in northern Brazil and Colombia.
- North America: Cool and wet winters in the southern United States; mild and dry conditions in the northern United States and Canada; increased atmospheric rivers on the West Coast.
- Australia and Southeast Asia: Severe droughts, heatwaves, and increased wildfire risk; reduced rainfall in Indonesia, the Philippines, and Malaysia.
- Africa: Droughts in southern Africa and Ethiopia; increased rainfall in East Africa (Kenya, Tanzania).
Pacific Islands: Changes in tropical cyclone patterns and reduced rainfall.
2. Fisheries and Marine Ecosystems:
- Reduced the upwelling of nutrient-rich water off the coast of Peru.
- Decline in fish populations, especially Peruvian anchoveta (the world’s largest monospecific fishery).
- Peru’s anchovy catch can decline by 50% or more during strong El Nino events.
3. Global Economic Impact:
- Affects food security for millions of people worldwide.
- Disrupts agricultural productivity and trade.
- Increases costs for disaster management and relief operations.
4. Atmospheric and Temperature Effects:
- El Nino years often produce some of the hottest years on record globally.
- Disrupts jet stream patterns, affecting weather in mid-latitude regions.
- Reduces Atlantic hurricane activity due to increased wind shear.
Global Impact of La Nina
1. Regional Weather Impacts:
- South America: Drought conditions in Peru and Ecuador; heavy rainfall and flooding in northern Brazil
- North America: Wetter and cooler conditions in the Pacific Northwest and Alaska; warmer and drier conditions in the southern United States; increased winter storm frequency in northern states
- Australia and Southeast Asia: Heavy rainfall and flooding, especially in Queensland, Australia and Indonesia; enhanced agricultural conditions but increased flood risk
- Africa: Increased rainfall in southeastern Africa; wetter conditions in East Africa can lead to flooding
- Pacific Islands: Increased tropical cyclone activity and elevated sea levels
2. Fisheries and Marine Ecosystems:
- Enhanced upwelling brings nutrient-rich water to the surface.
- Supports plankton growth and fish populations.
- Benefits of commercial fisheries off the coast of Peru and Chile.
3. Global Economic Impact:
- It can cause severe flooding with economic losses in Australia, Southeast Asia, and parts of South America.
- The 2010-2011 drought in the Horn of Africa (influenced by La Nina) affected over 13 million people.
- It can lead to humanitarian crises requiring international assistance.
4. Atmospheric and Temperature Effects:
- Enhances Atlantic hurricane activity due to reduced wind shear.
- Reduces Pacific hurricane and typhoon activity.
- Strengthens Walker Circulation, affecting global atmospheric patterns.
- Can contribute to more frequent tornadoes in the southeastern United States
Important Concepts Related to ENSO for UPSC
1. Walker Circulation
Walker Circulation is a large-scale east-west atmospheric circulation pattern over the tropical Pacific Ocean that forms the atmospheric component of ENSO.
Key Features:
- Air rises over the warm western Pacific (Indonesia, northern Australia).
- Air moves eastward at high altitudes.
- Air descends over the cooler eastern Pacific.
- Surface winds blow from east to west (trade winds), completing the circulation loop.
- During El Nino, this circulation weakens or reverses.
- During La Nina, this circulation intensifies.
2. Southern Oscillation Index (SOI)
The Southern Oscillation Index is an atmospheric indicator of ENSO that measures the pressure difference between Tahiti and Darwin.
Key Features:
- Sustained negative values (below -7) indicate El Nino conditions.
- Sustained positive values (above +7) indicate La Nina conditions.
- Values between -7 and +7 indicate neutral conditions.
- Calculated using the standardised anomaly of the mean sea level pressure difference.
- Helps monitor and predict ENSO phases.
3. Oceanic Nino Index (ONI)
ONI is the principal measure for monitoring, assessing, and predicting ENSO based on sea surface temperature anomalies in the Niño 3.4 region.
Key Features:
- Based on three-month running-mean SST departures.
- Measured in the Niño 3.4 region (5°N-5°S, 120°W-170°W).
- Values above +0.5°C for five consecutive months indicate El Niño.
- Values below -0.5°C for five consecutive months indicate La Niña.
- Values between -0.5°C and +0.5°C indicate neutral conditions.
4. Upwelling
Upwelling is the process by which cold, nutrient-rich water from the deep ocean rises to the surface.
Key Features:
- Occurs naturally along the coast of Peru and Ecuador during normal and La Niña conditions.
- Brings nutrients that support plankton and fish populations.
- Reduced during El Nino events, affecting marine ecosystems.
- Critical for supporting the Peruvian anchovy fishery (the world’s largest monospecific fishery)
5. Indian Ocean Dipole (IOD)
IOD is a climate phenomenon similar to ENSO but occurs in the Indian Ocean, characterised by temperature differences between the western and eastern Indian Ocean.
Key Features:
- Positive IOD: warmer waters near Somalia, cooler near Indonesia – beneficial for the Indian monsoon.
- Negative IOD: cooler waters near Somalia, warmer waters near Indonesia – can suppress the Indian monsoon.
- Can interact with ENSO to affect the Indian monsoon
6. Trade Winds
Trade winds are permanent, east-to-west prevailing winds that blow in the Earth’s equatorial region, between 30°N and 30°S latitude.
Key Features:
- Blows from the northeast in the Northern Hemisphere and southeast in the Southern Hemisphere
- Push warm surface water from east to west across the Pacific Ocean.
- Weaken during El Niño and strengthen during La Niña
- Named “trade winds” because they historically aided sailing ships in commerce
7. El-Modoki
El Nino Modoki is a distinct variation of the traditional El Niño phenomenon, characterised by anomalous warming in the central Pacific Ocean rather than the eastern Pacific.
Key Features:
- Warm SST anomaly in the central Pacific near the International Date Line, flanked by cooler waters (tripolar pattern).
- Creates a two-cell Walker Circulation instead of a single-cell pattern.
- Increases Atlantic hurricane frequency and landfall potential (opposite of traditional El Nino).
- More effectively reduces the Indian monsoon and increases the Bay of Bengal cyclones.
2. Compare the Economic Impacts: Crude Oil vs. Weak Monsoon
| Impact Metric | Crude Oil Price Surge | Weak Monsoon Shock |
|---|---|---|
| Primary Target | Industrial costs, import bill, transport | Agriculture, rural income, food prices |
| Inflation Type | Imported / Cost-push inflation | Domestic / Supply-side food inflation |
| Trade Balance | Widens the current account deficit | Can trigger export bans on food grains |
| GDP Impact | Hurts manufacturing and margins | Directly lowers primary sector growth |
| Policy Response | Fuel tax cuts, strategic reserves | Interest rate hikes, free food extensions |
Knowing the Indian Monsoon
India is popularly known as the land of monsoons. Scientifically speaking, monsoon winds are caused due to the difference in land and sea temperatures. The sweep of this wind system is set in the rhythm of summer and winter seasons. The land surface becomes comparatively warmer in summer and cooler during winter while the temperature at sea remains relatively constant. As a result, massive convective air currents are set up over the land in summer. Cool and humid air from the sea surface travels towards the land to fill up the vacant space in the area of low pressure. The moisture-laden wind starts blowing from the sea towards the landmass during the summer season. In winter, the landmass is comparatively cooler and the slowing down process is called ‘retreating monsoon’. The monsoon affects the Indian agriculture in a substantial measure. The massive impact of the monsoon on Indian economy is indeed very apparent. Therefore, a former Finance Minister referred to the country’s budget as “a gamble in monsoon rains”.
The onset of monsoon is expected every year normally in the month of June. The Indian masses, especially the rural people, anxiously wait for the arrival of monsoon. The mass media also become careful in heralding the onset of monsoon. The coming of monsoon is in itself a spectacular phenomenon accompanied by heavy dark clouds, violent squeals and thunderstorms.
Surprising climatic incidence takes place during the pre-monsoon period. States like Assam, West Bengal, Orissa, Jharkhand and Bihar experience violent thunderstorms in April and May. This is the well known ‘North-Western Monsoon’, locally called ‘Kal Baisakhi’. These thunderstorms typify strong consecutive motion in the local atmosphere. Whenever pre-monsoon cyclonic activities are severe and frequent, it is difficult to distinguish between pre-monsoon thundershowers and arrival of genuine monsoon rains. The progress of the monsoon in India can be conveniently traced to two of its branches namely, the Arabian Sea Branch and the Bay of Bengal Branch.
The Arabian Branch normally touches Kerala coast in the first or second week of June and advances northward to reach Mumbai by June 10 to 15. But it may come earlier or get delayed depending upon the prevailing atmospheric conditions. Such departures are very much expected in the case of arrival of monsoon. In the meantime, the progress of Bay of Bengal Branch is no less spectacular. It moves northward from the Central Bay area and rapidly spreads over most of Assam and Bengal (including Bangladesh) by mid-June. On reaching the southern periphery of the Himalayan barrier, the Bay Branch of the monsoon is deflected westward. It moves towards Ganga plains of the country rather than towards Burma Hills. The remaining part of Western Uttar Pradesh, Haryana, Punjab and East Rajasthan experiences the first monsoon showers by the end of June or in the first week of July. This year, due to drought condition prevailing in Central and Western India, an early arrival is expected.
Mountain Ranges have a profound influence on the Indian monsoon. The Bengal Branch of monsoon, after crossing coast, comes under the influence of the hilly curve of the Eastern ranges of Himalayas. The result is that the southern slopes of Assam hills and Meghalaya experience heavy rainfall. The rest of the monsoon current is deflected westward by the high barrier of the Himalayan mountains. The Southern slopes of the barrier; extending from Sikkim to Kashmir, receive rain almost every day during the monsoon months.
In the peninsular India, the Western Ghats represent a series of hills that abruptly rise from the coastal plain to an altitude of 1 to 2 kms. It is an undulating rocky ranges all running parallel to the west coast. The monsoon winds, after hitting these ranges, advance towards the Deccan Plateau, Madhya Pradesh and the Bay of Bengal. Since they have already shed their moisture at the seaward side of the Western Ghats, the quantity of rainfall on the other side of the Ghats is substantially less, forming a rain shadow.
In the peculiar circumstances, the Indian farmer has no escape. He has to face the same devil each year at his field. This drama of mighty nature has been witnessed on a grand scale. Excessive monsoon rains lead to floods in several areas, while no rain in other parts results in severe drought and famine conditions. Such fluctuations in quantity and timing of monsoon rainfall have attracted the people’s attention in general and farmer’s in particular. Recently, some scientists established the precipitation capacity of monsoon with the movement of an oceanic current known as A1 Nino.
It is a well-known fact that success of Indian agriculture depends largely on the monsoon. The failure of monsoon to bring sufficient rain could well lead to a crisis of considerable magnitude. The scientists and technologists at this stage are not able to eliminate the conditions resulting in the failure of monsoon. Now, improved techniques of weather forecasting could provide timely information for agricultural operations so that desired and appropriate steps may be taken well in advance. A “16 parameter model” developed by a team of Indian Meteorologists under the guidance of Dr. V.R. Gowarikar, has enabled near successful prediction of monsoon rains in a given time and area.
The observations of various meteorological parameters are necessary for preparation of general forecast. Now, the satellites are providing us new and latest observational data required for proper analysis. The field of observation includes temperature, sea surface condition, winds and cloud levels. Our satellites are currently operational and providing useful information. Now, our scientists are also obtaining important scientific details from the National Remote Sensing Agency and Super Computer System installed in Indian Meteorological Department, New Delhi for the purpose. This time, it is expected that monsoon will arrive earlier and will be almost normal.
3. Track Macroeconomic Vulnerabilities
Inflation and Interest Rates
- Food holds a heavy weight (~46%) in India’s Consumer Price Index (CPI).
- Spiking food prices force the Reserve Bank of India (RBI) to keep interest rates high.
- High interest rates increase borrowing costs for businesses and consumers.

India launches satellites and exports software to Fortune 500 companies. It also, every June, collectively holds its breath waiting for rain. That is not a contradiction. It is just what the economy actually looks like when you get past the headline numbers.
How much agriculture still matters
The direct GDP contribution of agriculture sits somewhere between 15 and 18%. That figure gets cited often and understood poorly. The more relevant number is employment, which is close to half the workforce. Rural incomes, which feed into consumption of everything from biscuits to tractors to two-wheeler loans, depend heavily on what happens between June and September.
A good Kharif season of rice, pulses, oilseeds, and cotton means farmers have money. Farmers with money buy things. Companies that sell things to rural India report better volumes. Food prices stay calm. The RBI gets room to cut rates. The government spends less firefighting rural distress.
Run that sequence backward and you get what a bad monsoon looks like.
The 2026 monsoon: what the forecasts are actually saying
This year, the monsoon story has an uncomfortable edge. IMD’s updated long-range forecast puts seasonal rainfall at 90% of the Long Period Average, with an 84% probability of below-normal or less rainfall for the country as a whole. That is not a drought call, but it is not a comfortable number either.
IMD projects below-normal seasonal rainfall across most parts of the country, with the exception of some areas in northwest and northeast India, eastern parts of peninsular India, and isolated pockets of east India. The monsoon core zone, which covers most of India’s rainfed agricultural areas, is where the below-normal signal is most concerning. This is precisely the geography that determines Kharif output.
As of mid-June 2026, the southwest monsoon is advancing into parts of Telangana, Odisha, Jharkhand, and Bihar, with the progression broadly on track geographically even if total rainfall is running below average. Cumulative season rainfall from June 1 to June 10 was running 26% below normal.
The distribution story matters as much as the total. A national average that looks manageable can still mask significant deficits in key crop states. Investors and analysts watching the monsoon should track state-level data, not just the national headline.
Which sectors actually move
Not everything in the Indian stock market cares about rainfall equally. Some sectors have a direct line to farm income; others feel it a quarter later through consumption data.
| Sector | Why it moves | Direction |
| FMCG | Rural volumes in staples, oils, soaps | Up with good rain |
| Agrochemicals and fertilisers | Farmer input spending rises | Up with good rain |
| Tractors and farm equipment | Farmer confidence and cash | Up with good rain |
| Microfinance and rural NBFCs | Borrower repayment capacity | Up with good rain |
| Two-wheelers | Rural accounts for large share of demand | Up with good rain |
| Food commodities | Prices ease when harvest is strong | Mixed |
Sector rotation ahead of monsoon outcomes is real. Fund managers start positioning on IMD forecasts in April, months before a grain of rice is planted. The 2026 forecast has already created caution around rural consumption themes. FMCG and two-wheeler stocks have seen some pressure in recent weeks as the below-normal signal became clearer.
The RBI angle most investors underestimate
Food carries significant weight in India’s CPI basket. Vegetables, cereals, and pulses are not small line items. One bad monsoon can push headline inflation up enough that the RBI cannot cut rates even when the rest of the economy is slowing.
This has happened repeatedly. A rate cycle that looked set to ease gets delayed because onion prices spike or pulses become expensive. Fixed-income investors feel it directly. So do real estate developers, NBFCs, and anyone whose earnings model assumes cheaper borrowing costs in the near term.
IMD explicitly flagged that below-normal rainfall may lead to challenges for agriculture, water availability, and hydropower generation, with increased risks of drought and heat stress. If those risks materialise in crop-growing states, the food inflation channel becomes the primary mechanism through which the monsoon affects monetary policy, and through monetary policy, the broader equity and debt markets.
A good monsoon does not just help farmers. It quietly clears the path for monetary policy to do what growth needs. A below-normal one closes that path just as quietly.
What has and has not changed
The dependence has eased. It has not disappeared.
Reduced but still real:
- Irrigation has expanded, and a meaningful share of farmland is no longer purely rain-fed
- Services and manufacturing have grown large enough that agriculture’s GDP weight has fallen over time
- A storage and buffer stock policy cushions some of the immediate price impact from a single bad year
Still very much intact:
- More than half of cultivated land still depends on rainfall
- Rural purchasing power remains the engine behind FMCG volume growth, entry-level auto sales, and microfinance loan quality
- Food’s weight in CPI means one difficult season can delay rate cuts, tighten fiscal space, and dampen consumption across a wide range of sectors
The 2025 season was a useful illustration of the upside. The monsoon arrived broadly on time, delivered near-normal rainfall, and rural consumption held up through the second half of the year. FMCG volumes and two-wheeler sales recovered. The RBI found enough comfort in food inflation to stay on its rate path. 2026 is shaping up as a test of the downside scenario, not a worst-case but not a benign one either.
What to watch between June and September
The monsoon is not a single event. It is a four-month sequence, and different points in that sequence send different signals for markets.
- IMD’s spatial distribution data matters as much as the national total. A national average that masks drought in key crop states of Maharashtra, Madhya Pradesh, Uttar Pradesh, and Rajasthan still damages Kharif output even if the headline number looks acceptable
- Reservoir levels by August determine how much water is available for the Rabi winter crop, extending the monsoon’s influence well beyond September and into Q4 FY27 earnings
- Food inflation prints from July onwards are the first hard signal of whether the season is feeding through to consumer prices. Watch vegetables and pulses specifically
- Kharif sowing data released weekly through July and August tells you what farmers are actually doing on the ground, which is a more reliable signal than weather forecasts alone
- RBI commentary at the August and October MPC meetings is where rainfall outcomes visibly shape rate expectations. If food inflation is running hot by August, the language around rate cuts will shift
What the 2026 season means for investors right now
The below-normal forecast is not a reason to exit rural consumption stocks wholesale. Forecasts carry model error, spatial distribution can surprise positively in key states, and markets partially price these risks ahead of the season.
What the forecast does is shift the probability distribution. The base case for rural consumption recovery in the second half of FY27 has weakened. Sectors with high rural dependence, like entry-level two-wheelers, mass-market FMCG, and microfinance, carry more earnings risk than they did when the season looked more benign. Rate-sensitive sectors carry more risk if food inflation delays RBI action.
The investors best positioned to navigate this are the ones who track the monsoon through its actual progression rather than reacting to the season forecast in April and then ignoring the data that accumulates through July.
Conclusion
India’s economy is more complex than it was twenty years ago. The monsoon’s grip has loosened at the margins. It has not let go.
Rainfall still shapes rural incomes, food prices, the RBI’s decisions, and the earnings of some of the most widely held stocks in the country. In 2026, with the forecast pointing toward a below-normal season and early cumulative rainfall already running a deficit, treating the June to September window as background noise is a more expensive mistake than usual. The data will come in weekly.
Fiscal Strain
- The government must spend more on rural relief and employment schemes like MGNREGA.
- Import duties on edible oils or pulses may be cut, reducing tax revenue.
- Lower rural corporate profits lead to lower tax collections.
Indian Economy Rainfall Project document discusses how rainfall impacts the Indian economy. It notes that India’s tropical monsoon climate means rainfall varies significantly across regions and years. Approximately 76% of India’s annual rainfall occurs during the June-September southwest monsoon season. The economy is highly dependent on agriculture, which relies on monsoon rainfall. In years with deficient rainfall, agricultural production and GDP growth declines. Specific sectors like food grain production, power generation, and rural spending are all strongly influenced by annual monsoon rainfall patterns.
4. Implement Corporate and Government Mitigation Strategies
- Enhance Irrigation Infrastructure: Expand micro-irrigation systems to reduce rain dependency.
- Shift Crop Patterns: Encourage farmers to plant climate-resilient, less water-intensive millets.
- Manage Food Supplies: Deploy buffer stocks strategically to control open-market food prices.
- Adapt Corporate Supply Chains: Fast-moving consumer goods (FMCG) firms must adjust inventory and pricing for rural markets.
India urges crop shift for monsoon planting as rains falter is urging farmers in rain-fed areas with limited irrigation to shift to less water-intensive crops such as pulses, oilseeds and millets as authorities prepare for a potentially weak monsoon.
(June 24): India is urging farmers in rain-fed areas with limited irrigation to shift to less water-intensive crops such as pulses, oilseeds and millets as authorities prepare for a potentially weak monsoon that could weigh on agricultural output.
The push by the farm ministry is part of a broader effort to prepare for the 2026 monsoon planting season after rainfall since June 1 has run 42% below normal, prompting New Delhi to step up coordination with states to safeguard farm output and rural incomes.
Authorities have identified 315 districts vulnerable to below-normal rainfall, including 111 high-priority areas with limited irrigation coverage, the farm ministry said Tuesday after Agriculture Minister Shivraj Singh Chouhan held a virtual review with state officials. District-level contingency plans will guide crop choices, water management and emergency responses if rainfall remains deficient, it said.
Most of the affected districts are spread across 12 states, including Madhya Pradesh, Maharashtra, Gujarat, Uttar Pradesh, Karnataka and Andhra Pradesh, the ministry said. Several of them are among India’s largest producers of soybean, sugar, cotton, peanuts, corn and rice.
The government is stepping up water-conservation efforts, including repairs to ponds, reservoirs, check dams and farm storage structures, while monitoring reservoir levels across river basins, the ministry said. States have also been asked to prepare contingency plans for drinking water and irrigation supplies, it said. Persistent heat across parts of South Asia has depleted soil moisture in areas that received little rainfall in the seven-day period to June 20, increasing stress on early-sown crops, the US Department of Agriculture said in its weekly weather and crop bulletin Tuesday.
New Delhi is also expanding access to crop insurance, farm credit and income support programmes. Rice and wheat stockpiles remain ample, the ministry said, limiting any immediate threat to food security despite concerns over a weak monsoon.