Astronaut captures veins of Amazon, largest river in the world, from space
In the image, shared from orbit, the Amazon appears almost like a living organism, its vast network of tributaries branching out like veins across tens of kilometres of floodplain.
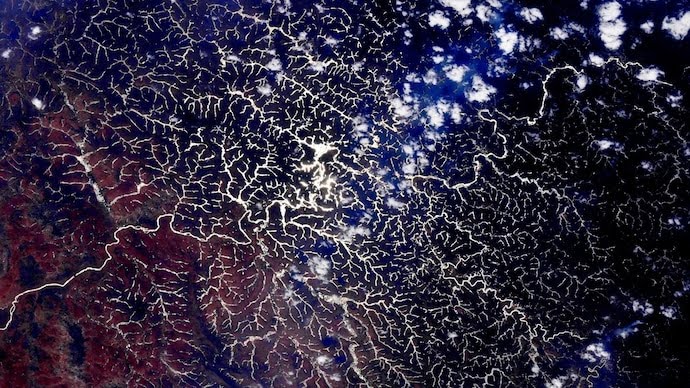
The sunglint effect turns the maze of waterways into a striking natural map. (Photo: X/@astro_Pettit)
In the image, shared from orbit, the Amazon appears almost like a living organism, its vast network of tributaries branching out like veins across tens of kilometres of floodplain. The main river snakes toward the Atlantic Ocean, accompanied by winding secondary channels, oxbow lakes, and floodplain lakes that glisten in the stark black-and-white rendering.
The sunglint effect turns the maze of waterways into a striking natural map, revealing the breadth and complexity of the river system, which sustains one of the most biodiverse ecosystems on Earth.
The Amazon’s scale is apparent from orbit. Its floodplains stretch across vast swaths of northern South America, dotted with ponds, lagoons, and countless shifting waterways.
Scientists emphasise that such imagery is not just visually captivating but scientifically valuable. Observations from space help researchers study river dynamics, from how channels shift during seasonal floods to how tributaries redistribute water during heavy rains.
Astronaut Don Pettit has once again turned his lens toward Earth, this time capturing a mesmerising view of the Amazon River basin from space.
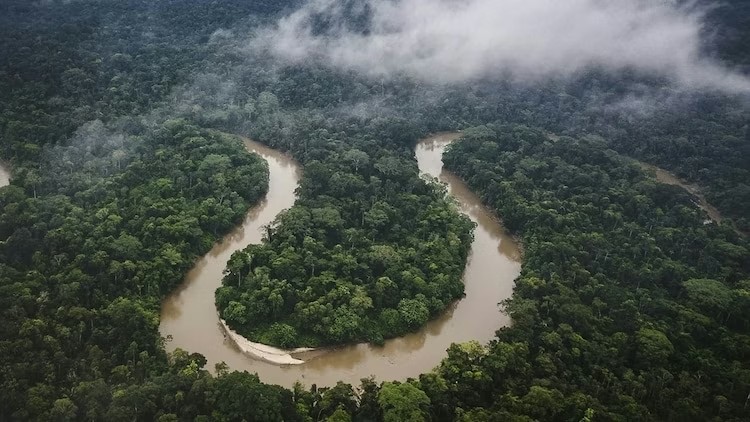
Amazon’s floodplains stretch across vast swaths of northern South America, dotted with ponds, lagoons. (Photo: Reuters)
These views are critical for understanding sediment transport, the extent of floodplains, and evolving flooding patterns in a region where climate change is intensifying rainfall extremes.
Equally important, the pictures shed light on human impacts. Even from orbit, deforestation and land-use changes appear as sharp contrasts against the dense green forest bordering the waterways. These signs highlight the growing influence of logging, agriculture, and development on the integrity of the Amazon basin.
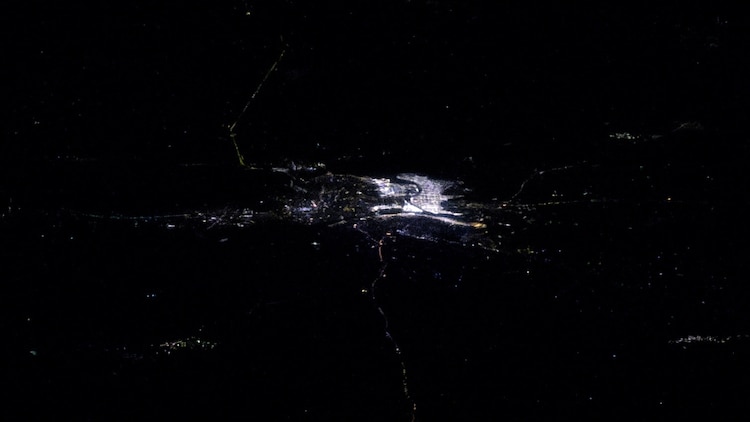
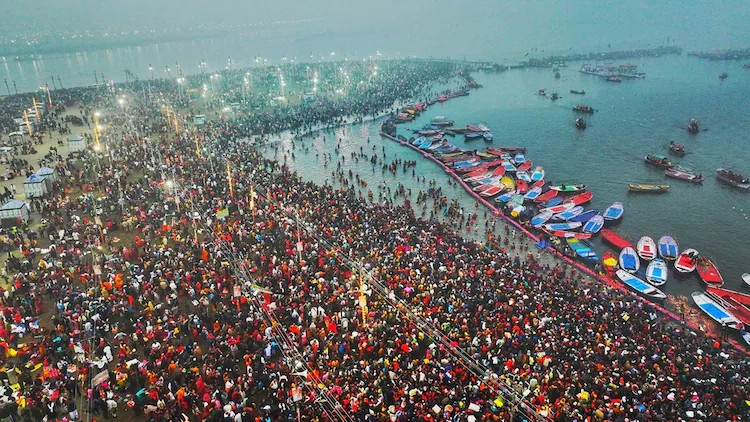
Maha Kumbh mela was recently captured by an astronaut flying above India aboard the International Space Station.
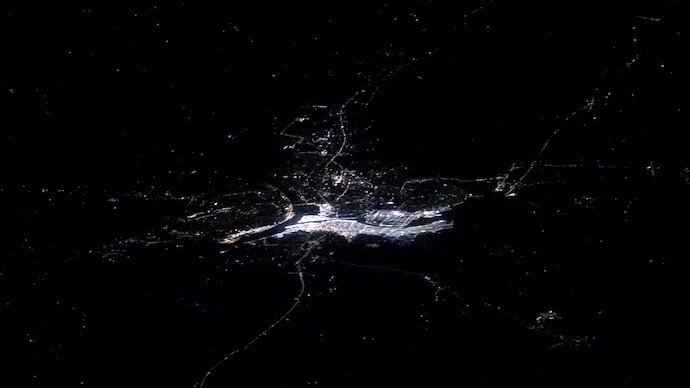
Maha Kumbh mela in Prayagraj seen from space. (Photo: X/@astro_Pettit))
Flying above India, Nasa astronaut Don Pettit has shared stunning pictures of the Maha Kumbh mela underway in Pryagraj. The images were captured from the vantage point of space as the International Space Station (ISS) flew over India.
“2025 Maha Kumbh Mela Ganges River pilgrimage from the ISS at night. The largest human gathering in the world is well lit,” astronaut Don Petit said in an update on social media platform X with illuminating pictures of the confluence of Ganga.
This is not the first time that the auspicious event, one of the biggest holy gatherings in the world has been captured from space. The Indian Space and Research Organisation (Isro).
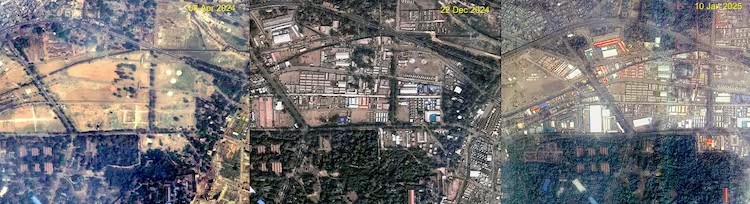
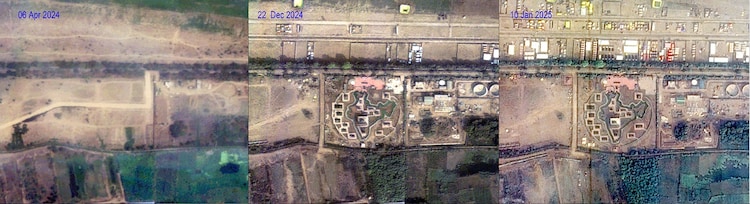
Maha Kumbh: Isro images show a massive infrastructure made at Prayagraj’s Maha Kumbh Mela site where 400 million people from across the world are expected to gather.
Isro image of Prayagraj’s Shivalaya Park.
The Maha Kumbh mela, being held in Uttar Pradesh’s Prayagraj, is so grand that it can be seen from space and the images released by Indian Space Research Organisation (Isro) show what the fair looks like from up above. Over 400 million people are expected to attend that 45-day-long grand event, which began on January 13.
This iconic religious gathering, held every 12 years, is touted as the world’s single largest religious gathering. A huge number of pilgrims, visitors, and sadhus are attending the event.
The images by Isro show a massive infrastructure made at the fair which is being attended by millions of people from across the world.
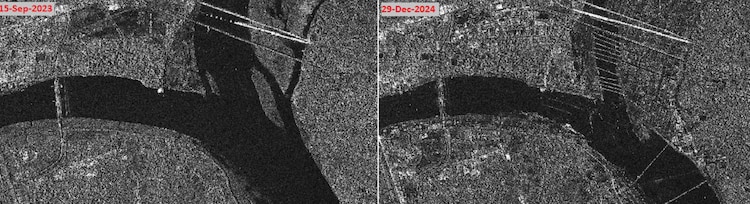
Satellite imagery from January 17 showed the bathing ghats near the Sangam heavily crowded with devotees. It also shows thousands of red, white, and yellow tents across the riverbank of Sangam, along with several boats taking devotees on rides.
Isro image of Prayagraj’s Parade Ground.
According to officials, 1.6 lakh tents and 50,000 shops have been set up for the event.
FIRE INCIDENT
A massive fire broke out in the Maha Kumbh Mela area on Sunday evening, starting in the kitchen of the Geeta Press camp. The blaze quickly spread, destroying six tents and 40 temporary shelters. While no casualties were reported, one person, identified as Jaspreet, sustained injuries while trying to escape the scene.

This year, the Kumbh Mela – being held at the confluence of the Ganges, Yamuna and Saraswati rivers – holds even more significance as it is taking place after 144 years, due to a rare alignment of planets. A Poorna Kumbh occurs every 12 years. The Maha Kumbh is a form of Poorna Kumbh which is held once in 144 years. In a rare occurrence, the Moon, Sun, Mercury and Jupiter align together, making the Maha Kumbh the most auspicious Kumbh Mela and a once in a lifetime experience.
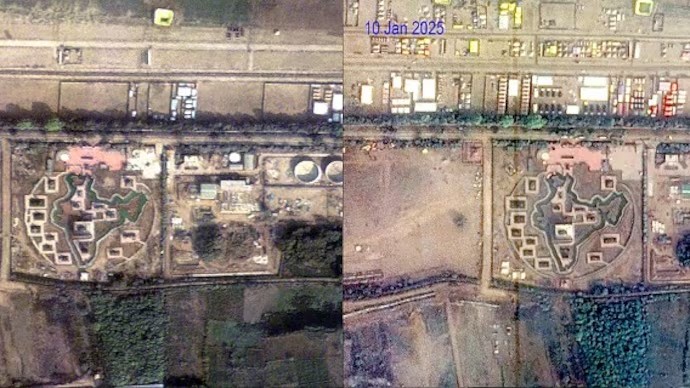
Satellite images accessed by India Today show the campsite of the Geeta Press near to the railway bridge in the sector 19 area. These pictures were taken on January 17th, days before the fire incident.
The incident site is visible in the satellite imagery captured by US based space firm Maxar Technologies, showing red tents and shelters located right beside the railway bridge. The campsite was located near the riverside.
.
The images by Isro showed a massive infrastructure push at the fair which is being attended by millions of people from across the world.
Satellite imagery from January 17 showed the bathing ghats near the Sangam heavily crowded with devotees. It also shows thousands of red, white, and yellow tents across the riverbank of Sangam, along with several boats taking devotees on rides.
Over 400 million people are expected to attend that 45-day-long grand event, which began on January 13.
The unique beauty of Kumbh lies in the confluence of three rivers and its spiritual significance.
Chief Minister Yogi Adityanath extended invitations to President Droupadi Murmu and other dignitaries for Mahakumbh 2025 in Prayagraj. The government has intensified outreach efforts ahead of the grand event.

Yogi Adityanath invited President Droupadi Murmu, Vice President Jagdeep Dhankhar to attend Mahakumbh 2025. (Photo: X/@myogiadityanath)
Uttar Pradesh Chief Minister Yogi Adityanath on Sunday invited President Droupadi Murmu and Vice President Jagdeep Dhankhar to attend the upcoming Mahakumbh in Prayagraj.
The Chief Minister also extended his invitation to Union Finance Minister Nirmala Sitharaman, and Delhi Lieutenant Governor Vinay Kumar Saxena to the grand event, scheduled to begin from January 13 and conclude on February 26, 2025.
As part of his invitation, Yogi Adityanath also presented special gifts, including a symbol featuring the Mahakumbh 2025 logo, a kalash (sacred urn), literature related to the event, a New Year table calendar and a diary.
On Saturday, defence Minister Rajnath Singh among others. Each of the dignitaries was presented with personalised invitation mementos related to the Mahakumbh.
The Mahakumbh Mela, a spiritual gathering, will take place in Prayagraj from January. Held every 12 years, the event is one of the most important festivals in Hinduism, drawing millions of devotees from around the world.

On Sunday, Chief Minister Yogi Adityanath expressed his gratitude to the dignitaries for their time via a post on his official account on the social media platform ‘X,’ along with the photographs of the meetings.
Uttar Pradesh Chief Minister Yogi Adityanath on Saturday met prominent leaders in New Delhi to extend invitations to the grand Mahakumbh 2025, scheduled to be held in Prayagraj.
The Chief Minister presented each dignitary with an official invitation accompanied by symbolic gifts, including a Mahakumbh 2025 logo, a Kalash (sacred urn), literature about the event, and a New Year desk calendar and diary.

Among those he met were former President Ram Nath Kovind, BJP National President JP Nadda, Home Minister Amit Shah, Defence Minister Rajnath Singh, and Mizoram Governor General (Retired) VK Singh.
Adityanath’s first meeting was with Mizoram Governor General (Retired) VK Singh at Uttar Pradesh Bhawan, where he personally extended the invitation. He later visited the official residences of former President Ram Nath Kovind, Home Minister Amit Shah, BJP National President JP Nadda, and Defence Minister Rajnath Singh to invite them to the event.
With the event only weeks away, the Uttar Pradesh government has ramped up efforts to invite dignitaries and members of the public from across the country, with the Chief Minister and his cabinet ministers personally spearheading outreach campaigns in various states.
While aboard his mission,shimmering under the effect of sunglint, sunlight reflecting directly off its surface, creating what he described as a “glowing fractal pattern” spread across the rainforest landscape.
Posted on social media, Pettit’s image offers a rare, high-contrast perspective of the world’s largest river delta, dramatically highlighting its vast, fertile landscapes spanning parts of eastern India and Bangladesh.
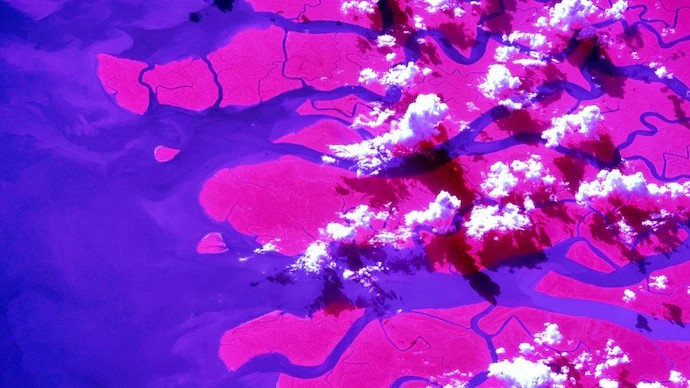
The Ganga river delta as seen from space in infrared. (Photo: X/@Don Pettit)
From space, an infrared view of the Ganga river delta shows a vibrant, multicolored landscape that reveals details about vegetation, water, and land features that are invisible to the naked eye. The colors in these false-color images depend on the specific wavelengths of infrared light captured by the satellite sensor. For example, in imagery from the French SPOT satellites:
NASA astronaut Don Pettit has shared a striking near ..
described the region as “the largest river delta on Earth,” ..
- Vegetation glows red. This vivid color indicates areas of dense, healthy plant life, such as the extensive mangrove forests of the Sundarbans in Bangladesh and eastern India.
- Water appears dark blue. The shade of blue indicates the water’s clarity; water rich with silt or sediment appears a paler shade of blue. This highlights the vast amount of sediment the river deposits as it flows into the Bay of Bengal.
- Exposed sediment is white. This includes sandy banks and mudflats.
- Urban areas appear blue-grey.
Detection of Aguadas (Ponds) Through Remote Sensing in the Bajo El Laberinto Region, Calakmul, Campeche, Mexi
What are the main findings?
- Lidar-derived Digital Elevation Models and Infrared high-definition imagery from satellites constitute the most efficient tools for identifying aguadas (ponds) in regions covered by dense forest.
- Three hundred fifty aguadas were identified in the Calakmul Biosphere Reserve.
What is the implication of the main finding?
- Lidar-derived Digital Elevation Model and Infrared high-definition satellite images and supplementary sources can be combined to enhance the identification of minor water bodies in densely wooded regions.
- Ponds in the Calakmul Biosphere Reserve exceed the number that has previously documented, and their identification is highly relevant for conservation and archeological studies.
Abstract
This study explores the detection and classification of aguadas (ponds) in the Bajo El Laberinto region, in the Calakmul Biosphere Reserve, Campeche, Mexico, using remote sensing techniques. Lidar-derived digital elevation models (DEMs), orthophotos and satellite imagery from multiple sources were employed to identify and characterize these water reservoirs, which played a crucial role in ancient Maya water management and continued to be vital for contemporary wildlife. By comparing different visualization techniques and imagery sources, the study demonstrates that while lidar data provides superior topographic detail, satellite imagery—particularly with nominal 3 m, or finer, spatial resolution with a near-infrared band—offers valuable complementary data including present-day hydrological and vegetative characteristics. In this study, 350 aguadas were identified in the broader region. The shapes, canopy cover, and topographic positions of these aguadas were documented, and the anthropogenic origin of most features was emphasized. The paper’s conclusion states that combining various remote sensing datasets enhances the identification and understanding of aguadas, providing insights into ancient Mayan adaptive strategies and contributing to ongoing archaeological and ecological research.
Keywords:
aguadas; ponds; lidar; Maya archaeology; Calakmul Biosphere Reserve; water management; satellite imagery; environmental monitoring
1. Introduction
In the Elevated Interior Region (EIR), the central spine of the Yucatan Peninsula, aguadas (ponds), are common features, many of which were built by the ancient Mayas as reservoirs and are typically associated with their settlements. In this seasonally waterless region, where perennial water sources are extremely scarce, reservoirs were essential for year-round occupation of towns and cities.
Aguadas possess a biocultural significance due to their strong association with ancient Mayan settlements [1] and their critical role in the modern forest as an essential source of drinking water for wildlife [2,3,4]. Consequently, comprehending their distribution is essential for analyzing settlement patterns, the management of hydraulic systems by the Maya, and for the conservation of fauna dependent on these bodies of water.
Documenting aguadas is challenging due to their remote locations deep within the forest, lacking access roads and proximity to populated areas. Moreover, given their abundance, it is nearly impossible to visit all of them, which is why turning to remote sensing techniques is the most efficient means to ascertain and comprehend their distribution.
To date, only García et al. [5] have recorded the aguadas at a regional scale inside the tropical forest of the Calakmul Biosphere Reserve (CBR) in Campeche, Mexico, utilizing aerial images captured by an aircraft. New remote sensing technologies, including satellite imagery and lidar, have proven more effective in documenting surface features, offering an opportunity to evaluate their efficacy while augmenting the record of aguadas in the region, thus enhancing archaeological and biological research.
This paper examines methods for the detection of aguadas using a combination of satellite images and lidar-derived digital elevation models (DEMs), focusing on the Bajo El Laberinto region, an area formerly densely populated by the ancient Maya situated in the southern part of the Calakmul Biosphere Reserve (CBR), an area presently devoid of permanent human occupation and heavily forested.
1.1. The Bajo El Laberinto Region and Its Significance in Maya History
Bajos, local karst landscape depressions, are a characteristic geomorphological feature of the EIR. These low-lying areas originate from a combination of limestone dissolution and faulting and range in size from smaller (one to several square kilometers or “pocket bajos”) to sprawling giants of over several hundred square kilometers, receiving runoff from surrounding areas of higher elevation and resulting in seasonal flooding [6,7,8]. These features are also sometimes called “poljes” in the geological literature [9,10,11].
The Bajo El Laberinto is located in the southeastern part of the state of Campeche and is one of the largest bajos in the EIR (Figure 1). The climate of the Bajo El Laberinto region is sub-humid tropical with an average annual temperature of 27 °C, with average extremes of 20 and 34 °C [12]. Mean annual rainfall is between 1200 and 1500 mm, most of which falls between June and November, during which time aguadas typically refill with water. However, inter-annual variation can be considerable, driven in part by the occurrence of tropical cyclonic storms and droughts that occur frequently.

Figure 1. Bajo El Laberinto and study area of the Bajo El Laberinto Archaeological Project. The Calakmul and Yaxnohcah lidar survey areas outlined. Base map Planet Labs, RGB, 12 April 2021.
In general terms, the vegetation of the Calakmul region has been classified as “moist semi tropical forest” [13] and “high to medium evergreen forest” [14], both of which recognize the profound effect played on plant growth by the wet–dry precipitation regime. Following ground surveys that included the identification of 1537 plant species, Martínez and Galindo-Leal [15] proposed a detailed classification of the vegetation of the CBR based on dominant species assemblages.
Using a combination of remote sensing imagery and ground survey, Vázquez-Alonso et al. [16] proposed a simpler classification that identified four types of forest: Upland, Transition, Lowland, and Wetland. Upland forest corresponds with well-drained limestone uplands, Lowland with bajos, and Transition with gradients between these two, whereas Wetlands correspond largely to aguadas and represent a small percentage (<1%) of the forest cover.
The Bajo El Laberinto is surrounded by numerous archaeological sites of varying size, including Calakmul, one of the largest sites in the Maya Lowlands [17,18,19,20], the large site of Yaxnohcah [21], and numerous smaller sites such as El Laberinto, Pared de los Reyes, Olvidado, and Los Tambores, among others [22,23,24]. In this study, two lidar-derived DEMs covering the Yaxnohcah-Pared de los Reyes and Calakmul areas along the northwest and southeast margins of Bajo El Laberinto were analyzed, covering a total of 252 km2, along with satellite imagery spanning some 1197 km2, covering the entire bajo and surrounding areas (Figure 1).
Bajo El Laberinto is thought to have played a major role in the early political-economic organization of the Maya Lowlands because of its potential use as an artery of trans-peninsular trade, a factor that may help account for the high density of ancient Maya communities in the region as well as the establishment of the powerful Kanu’l dynasty at Calakmul in the Late Classic period (550–800 CE) [25,26,27,28].
1.1.1. Overview of the Yaxnohcah-Pared De Los Reyes Area
This area has been investigated by the Yaxnohcah Archaeological Project beginning in 2011. More recently, the project has expanded its study area to include the entire Bajo El Laberinto region and changed its name to the Bajo El Laberinto Archaeological Project (PABEL by its initials in Spanish). Lidar was flown over 100 km2 in 2014 and includes the area of Yaxnohcah and the region around Pared de los Reyes [29] (see Figure 1). A key deliverable of the lidar data collection was a digital elevation model (DEM) of the ground surface under the jungle vegetation cover. Notable settlement features include large and small Preclassic (800 BCE–200 CE) triadic groups, pyramids, causeways, hundreds of residential patio groups, and dozens of aguadas, among other features.
Initial work focused on Yaxnohcah, a large site featuring numerous nodes of Preclassic monumental architecture, many of which were connected by causeways. Yaxnohcah continued to be occupied through the Classic period with at least some settlement in the Postclassic (900–1500 CE) [21,30,31,32,33,34,35]. One of the long-term research interests of the project has been the study of the regional physical-biotic environment and the long-term adaptive strategies of its inhabitants. As part of this investigation, the strategies used to obtain water have been an important focus.
These investigations included ground visits to aguadas identified on the DEM followed by excavations or sediment coring in some of these features [36,37]. Furthermore, GIS analysis was employed to identify smaller closed depressions visible on the Digital Elevation Model (DEM) as potential water-collecting and -storage features. Subsequent excavations revealed that many of these depressions had been modified to retain water, thereby functioning as “household reservoirs.” It is hypothesized that these domestic reservoirs originated as limestone quarries utilized for the production of construction materials [38,39].
Excavations and coring in seven large aguadas at Yaxnohcah by the project revealed that while these features may have originated as natural low spots in bajos, they were all heavily modified by human activity that included quarrying of bedrock, deepening of interior tanks, and enclosure within surrounding berms with periodic maintenance, especially dredging, also evident [40,41]. In short, these aguadas were largely anthropogenic in origin (Figure 2A).

Figure 2. (A) Aguada Mukal DEM view with photo showing an ancient Maya bukte’ (filtration well) revealed by excavation; (B) Aguada ChanGuis DEM view with photo showing laid stone floor buried under sediment as revealed by excavation. Base map lidar-derived DEM model, Visualization for Archaeological Topography. Photographs by Nicholas Dunning.
1.1.2. Overview of the Calakmul Area
The second Lidar dataset used in this study encompasses the northwest margin of Bajo El Laberinto, where the primary site of Calakmul was established. This center was one of the largest cities of the Classic Maya, and has been the subject of several in-depth investigations, including excavations and architectural restorations for many years and across different projects [17,18,19,42].
Calakmul’s aguadas were investigated by Ávila and Folan [18], who carried out an inventory of these reservoirs based on information provided by chicleros, men who ventured into the forest to tap the sap of sapodilla (gum) trees. Domínguez and Folan [18] and Folan et al. [43] subsequently conducted excavations in several of these reservoirs and proposed a classification system based on their topographic position and water storage capacity. Currently, the PABEL is investigating several aguadas at the site through field inspection, lidar-based analysis, and excavations (Figure 2B).
The second Calakmul-focused lidar-derived DEM used in this research was more recently obtained in 2022 and covers roughly 150 km2 along the northwest flank of the Bajo El Laberinto (Figure 1). The DEM encompasses not only the central area of Calakmul but also its surroundings, where numerous archaeological features, including causeways, platforms, terraces, field walls, and dozens of aguadas, have been identified. These elements reveal the extensive and complex modification of the landscape made by the ancient inhabitants of this region.
The PABEL is continuing efforts to identify, classify, and functionally analyze the region’s aguadas. An important part of this research is the initial identification of aguadas on both lidar and other imagery for areas for which lidar is not currently available, as described here.
1.2. Aguadas: Primary Characteristics and Definitions
The existence of aguadas and their anthropogenic nature was first brought to the attention of the outside world by John Lloyd Stephens in the mid-19th century as a result of his explorations of the Puuc and Chenes regions in the northern reaches of the EIR [44]. Other early outside visitors to the EIR noted the ubiquity of aguadas around ancient Maya sites, including Ruppert and Denison [24] in their explorations in southern Campeche. Such early archaeological explorers were often taken to sites for the first time by chicleros who depended on aguadas for water to survive during their dry season collection of chicle sap from the chico zapote tree.
In recognition of their importance to understanding the ancient Maya occupation of the EIR, archaeologists have been increasingly addressing aguadas and other water management features (e.g., [7,8,18,40,45,46,47,48,49,50]). The results of these works have shown that while some aguadas had a natural origin, they were highly modified, reflecting the hydraulic engineering skills of the ancient Maya, whereas others were clearly built entirely by Ancient Maya settlers.
Investigations of aguadas that have included excavations have ranged from the southernmost part of the EIR around Tikal [7,51] and El Zotz [52] to the region’s northern limits in the Puuc region at Uxmal, Xuch, and Xcoch [53,54,55,56]. These investigations have collectively documented the huge investment that the ancient Maya of the EIR made in the procurement of water, its storage, and cleanliness that was an integral part of their towns and cities. Thus, to better understand the distribution of ancient settlements, the identification of aguadas across the region is essential.
The Dictionary of the Royal Spanish Academy [57] defines an aguada as “Sitio en que hay agua potable a propósito para surtirse de ella” (place where there is drinking water with the purpose of storing it). This definition implies both the presence of clean water and the intentionality of the creation of these features. However, in its most common usage in the Maya Lowlands, aguada simply means a pond that contains water for at least part of the year. Across the low-lying coastal plains of northern parts of the states of Yucatan and Campeche, the term “aguada” is also used to refer to natural karst sinkholes, or “cenotes,” with contain water and feature clay-sediment plugged bottoms. For the purposes of this study, we exclude those areas on the coast and the north of Yucatán and focus on the water-bearing ponds of the EIR. Researchers have used a variety of definitions for aguadas within the EIR, as outlined in Table 1.
Table 1. Definitions of aguada.

Aguadas have various forms (rectangular, circular, rhomboid, irregular) and may be in several topographical contexts such as “bajo margin,” “in pocket bajo,” or “in bajo.” The variability in size and volume is also significant, ranging from a few square meters to 4 hectares for the largest reported case (Aguada 1 of Calakmul). Furthermore, it is possible to differentiate between open and closed canopy types.
Open canopy aguadas comprise a region of open space that, contingent upon the timing of image acquisition, may exhibit a visible pool of open water or sparse, herbaceous vegetation. The “open space” is characterized by a gap in the forest canopy, indicating an absence of trees in or above the water-holding area (Figure 3). In contrast, closed canopy aguadas have tree foliage that is sufficiently dense to obscure the visibility of any or most water.

Figure 3. Different views of aguadas. (A) Drone view of Aguada 5 of Calakmul, (B) ground view of Aguada Villahermosa, (C) drone view of Aguada Villahermosa. Photographs by Alberto Flores.
1.3. Location of Aguadas and Remote Sensing
Traditionally in Mayan archaeology, aguadas have been identified chiefly via ground survey, either via systematic mapping or by guidance by local informants [25,57]. Domínguez and Folan [18] recorded 494 aguadas for the southern area of the Calakmul Reserve, based on local informants including former chicleros, though the archaeologists only confirmed a small number of these features via site visits.
An extensive study carried out by García and his team [5], sponsored by the National Commission for the Knowledge and Use of Biodiversity of Mexico, CONABIO by its initials in Spanish [63], used a wide sample of aerial photographs to examine geomorphological and hydrological characteristics, land utilization, and conservation status of the CBR. This study constitutes the first investigation throughout the entire CBR region (including northern and southern segments), identifying a total of 1353 possible aguadas.
The original photographs used by these researchers are unavailable; however, the survey findings can be accessed and downloaded from the CONABIO online database [63]. This geographic database of water bodies will thereafter be employed to compare the findings presented in this research.
The application of lidar technology has revolutionized archaeology around the world [64,65]. In the Maya Lowlands, this technology has revealed the intricacies of ancient settlements, the spatial organization of sites, and the natural landscape, as well as the modifications made by the ancient Maya to the landscape, including roadways, agricultural terraces, canals, and water reservoirs, among other features.
An example of this technology’s application is the research conducted by Šprajc et al. [66], which employed a 230 km2 lidar-derived digital elevation model (DEM) of Chactún in the northern Calakmul Reserve to identify 94 aguadas, although none were excavated. In the Pared de los Reyes area, Dunning et al. [36] conducted a survey of aguadas employing a combination of the lidar-derived DEM, satellite imagery, ground visits, and sediment sampling. Additionally, Flores is conducting a supplementary survey involving field visits to aguadas near the Yaxnocah and Calakmul site core regions [37].
Conversely, satellite imagery also has been used to identify aguadas in the Maya area, as is the work of Thomas [67], who identified a series of aguadas in the northern part of Tikal National Park (Guatemala), using IKONOS and AirSAR satellite images and the application of filters and visualizations.
The variety of shapes, locations, and sizes of aguadas requires the comparison of multiple remote sensing information sources to determine the most effective method for locating them and enhancing the observation of their main characteristics.
2. Materials and Methods
For this study, we utilized four types of remote sensing data: a lidar-derived digital elevation model (DEM) with a spatial resolution of 50 cm per pixel, covering two areas around the Bajo El Laberinto; a collection of orthophotos derived from aerial photography captured by the Mexican Institute of Geography and Statistics, or INEGI as it is known by its Spanish initials [68]; satellite-derived web mosaics from Bing Maps (Microsoft, 2024) [69], ESRI (2024) [70], and Google Earth (Google, 2024) [71]; and satellite multispectral images from Planet (2024) [72] and the European Space Agency (ESA, 2024) [73].
This study employs multiple visualizations to compare and assess which images deliver better information for identifying aguadas and to determine their respective limitations. To illustrate the effectiveness of each source, we utilized five aguadas with varying types of vegetation as an example of the comparison process we conducted in this work (Figure 4).

Figure 4. Location of the five aguadas compared in this study. Base map Planet Labs, RGB composition, Date 12 April 2021.
Lidar-based imagery offers intricate detail and accuracy in topographic relief due to its ability to remove the vegetation and show the “bare earth”. Nonetheless, the costs associated with lidar data collection limit its utilization. Orthophotos are a significant source of remote sensing data due to their nationwide coverage and free accessibility. These monochromatic photos document the surface as it appeared at the moment of capture, including the vegetation and clouds present during the recording.
As a supplementary resource, satellite imagery has become increasingly cost-effective recently while also improving its spatial, spectral, and temporal resolutions. As a result, it has become a valuable source for identifying aguadas, as well as visualizing environmental changes over time. Although satellite imagery can be obstructed by objects such as clouds or vegetation, resulting in limited visibility of ground features, specific visualizations and bands (such as infrared) can overcome these limitations to a large degree.
Lidar, aerial photographs (orthophotos) and satellite imagery are acquired via fundamentally different technologies, each with its own set of pros and cons. By combining these three data sets and utilizing various visualizations, it is possible to find far more aguadas than in previous studies, such as the Garcia et al. survey [5], whose database is hosted on the CONABIO website [63]. In the subsequent section, we compare different image types and visualizations employed to construct a regional aguada database.
2.1. Lidar DEM and Visualization Techniques
The lidar digital elevation model (DEM) of the Yaxnohcah-Pared de los Reyes and the Calakmul region cover a total area of approximately 240 square kilometers with a spatial resolution of 50 cm. These DEMs underwent additional processing utilizing QGIS’s Relief Visualization Toolbox (RVT) plugin, which has been described in detail by Kokalj and colleagues [74,75,76]. RVT enables the automated generation of a variety of visualizations to enhance the identification of features and emphasize terrain characteristics that are not easily visible through conventional shading techniques like unidirectional hillshading.
Although each of the visualizations can be useful for identifying some features within the DEM, in many cases the combination of several provides better results for the identification of topographic features, buildings, and other elements of the landscape [68]. For the identification of aguadas, in addition to the basic hillshade visualization, we used a Simple Local Relief Model (SLRM) and Visualization for Archaeological Topography (VAT).
The SLRM is valuable for representing slight local elevation differences, eliminating larger-scale variations, and enhancing the visibility of shallow topographic features without depending on illumination angles [77]. This visualization effectively emphasizes minor slopes, making it an ideal tool for illuminating the berms bordering the aguadas and more accurately outlining their shape (Figure 5). The second visualization utilized, known as VAT, improves the identification of features in the DEM by amalgamating multiple visualizations into a single view. The sources employed for this combination include hillshade (HS) modeling, elevation gradient (SLP), positive topographic openness (OP), and Sky View Factor (SVF). These visualizations are combined as follows: SVF (blend type: multiplied, 25% opacity) with OP (blend type: overdose, 50% opacity) with SLP (blend type: lightness, 70% opacity) with HS.

Figure 5. Three visualizations of Aguada 259 in the lidar-derived DEM of Yaxnohcah-Pared de los Reyes area. (A) Simple unidirectional hillshade, (B) Simple Local Relief Model (SLRM) and (C) Visualization for Archaeological Topography (VAT).
2.2. Orthophotos Derived from Aerial Photographs
The photos are derived from aerial photographs captured by aircraft, from which displacements caused by camera or sensor tilt and lens aberrations have been removed, and they have been corrected and rectified by photogrammetric methods. Additionally, they have been orthogonally projected and georeferenced inside the national cartography of INEGI. This organization has utilized aerial photography techniques for around 48 years, employing scales of 1:20,000, 1:10,000, and 1:5000 [78].
The photographs are accessible on the INEGI website, and the aforementioned scales are available throughout Mexico. Orthophotos serve different purposes, such as mapping, land use, agriculture, cadastral, hydrology, vegetation evaluation, and land planning, among others [79,80,81]. Aerial photographs offer the advantage of being captured from a closer distance than satellite images, yielding enhanced spatial resolution compared to other remote sensing methods.
INEGI is presently assembling these orthophotos by integrating aerial photography and satellite imagery; however, the images from the decade preceding 2010 were sourced from aerial photographs captured by aircraft [78]. This analysis employed 1:20,000 scale photos, covering the whole Bajo El Laberinto region. The spatial resolution of these photos is 1.5 m per pixel, and they were captured in March 2003, as indicated by INEGI. Nonetheless, these photographs are monochrome and may be covered by clouds situated between the camera and the photographed area.
The orthophotos are acquired in raster format, with .bil or .tiff extensions, and upon download, they were included into QGIS (Figure 6). No further processing was conducted on these images, and the discernible aguadas in the set were identified and marked.

Figure 6. Orthophoto visualization of Aguada 259, provided by INEGI.
2.3. Satellite Images and Visualization Techniques
Satellite imagery is used across diverse fields, including agriculture, ecology, sustainable development, hydrology, meteorology, urban planning, and archaeology, among others [82,83]. Such imagery is sourced from active sensors that emit and receive energy, or passive sensors that only receive energy from the electromagnetic spectrum.
Electromagnetic energy travels in waves, creating what is known as the electromagnetic spectrum, which ranges from longer radio waves to very short gamma rays that pass through a series of intermediate amplitudes. Although the human eye can only perceive a small portion of the spectrum corresponding to visible light, other wavelengths can be captured by sensors and devices, imperceptible to our eyes [84]. Most satellites utilize sensors of this nature to gather diverse segments of the electromagnetic spectrum that are reflected from the surface of the Earth. The resultant images are composed of separate bands, each representing a precise range of electromagnetic wavelengths.
Of particular interest for this study is the near-infrared band (NIR), which constitutes the portion of radiation situated immediately beyond the visible spectrum. NIR is subject to absorption, transmission, and reflection by Earth’s surface, vegetation, and water in a specific manner that enables the detection of several characteristics not discernible to the human eye.
For instance, during photosynthesis, plants absorb blue and red light to produce chlorophyll. As a result, a healthy plant with higher chlorophyll content will reflect more near-infrared energy compared to a diseased plant with lower chlorophyll levels. Consequently, healthier vegetation will appear more vibrant in reds when visualizing this band (NIR) combined with red and green bands, while those with low chlorophyll levels or diseases will appear paler. Likewise, regions lacking vegetation will exhibit a white or near-white hue [84,85,86].
The behavior of water in the NIR portion of the spectrum is a crucial indicator for this study. The absorption of energy by water allows for exact and effortless delimitation, while water’s reflection of light helps ascertain its composition. For instance, in a visualization utilizing an NIR+R+G combination, dark blue indicates water clarity, whilst cyan hues represent turbidity. This is because suspended particles and turbidity reflect more light, preventing its penetration, a phenomenon not observed in clear water where all light is absorbed [84,85]. Satellite imagery has become a widely used tool for delineating and monitoring water bodies in various regions [87].
RGB Mosaic Images from Web Platforms
Web-based mosaics display true color images that are generated using combinations of red, green, and blue (RGB) bands. It should be noted that the images are already rendered into a mosaic and are ready for user navigation. Although several mosaics produced by various companies achieve impressive peak spatial resolutions, there exists a considerable variation within the mosaic, ranging from 60 cm to 30 m per pixel, contingent upon the pictures utilized for mosaic integration, resulting in variable utility.
It is not always possible to easily access the technical information of the base image, such as the resolution and date they were taken, or the origin of the image itself, since only the update date of the mosaic is typically shown on the screen and, in some cases, the source of the image, but without further details. Although it is possible to access the metadata of the visualization through the developer mode of Internet browsers such as Mozilla or Chrome, the information is found within the programming code of the web page and only accounts for the spatial resolution of the image and the date of creation.
The primary advantages of these internet mapping platforms include global coverage, minimal cloud interference, and varied zoom levels that can reach up to 19 or more levels of magnification. Another advantage of the images provided by Internet mapping platforms is their accessibility, as they can be viewed on any device with an Internet connection without the need for additional software and can be easily accessed through any Web browser. Although specialized applications for mobile devices or PCs are available, they are not necessary for most applications. Furthermore, the navigation between tiles exhibits exceptional intuitiveness, providing the ability to attach Supplementary Information layers, including vector layers, that can be overlaid.
Although multiple online mapping platforms are available, this study utilizes widely used options including BingMaps [69], ESRI [70], and Google Earth [71] (Figure 7). These platforms were integrated into QGIS (v.3.34) by means of Tile Map Service (TMS) or the Quick Maps Service plugin (2024) [88]. It is important to note that these web mosaics are regularly updated and may include new, higher-resolution satellite imagery in the future. Additionally, platforms like Google Earth and ESRI feature a history of mosaics, which can provide valuable insight into how an area has changed over time, with varying levels of spatial resolution.

Figure 7. Three visualizations of Aguada 259, web platform visualizations. (A) Bing Maps, (B) ESRI and (C) Google Earth.
2.4. Multispectral Imagery
As a fourth source of data, the study utilized multispectral images from two satellite constellations, Sentinel 2 and Planet. Sentinel 2, developed by the European Space Agency (ESA), provides images with 13 spectral bands and a resolution range of 10–60 m. It covers land areas since 2015 and updates every five days. Its primary advantage lies in its spectral resolution because it covers a significant segment of the electromagnetic spectrum. Consequently, the imagery generated by this constellation is highly beneficial for multiple studies.
Sentinel 2 images are open access and have a historical archive that goes from 2015 to the present, which can be easily consulted on the U.S. Geological Service website [89], where it is possible to select an area of interest and the date required to carry out a specific investigation.
The other set of multiband images used was the Planet constellation, which is compiled by a private company of the same name. This company has a wide variety of products, and the complimentary imagery used for this study includes only four bands, RGB (red, green and blue) and Near Infrared (NIR), with a spatial resolution of 3 m. Even though these images have fewer spectral bands than the previously mentioned ones and are not as useful for some studies, they are very useful for the identification of small features, given their high spatial resolution.
Another great advantage of Planet images is the temporal resolution provided by its large image repository, which has daily imagery data captured by the satellite network. This feature enhances the chance of finding cloud-free imagery from different times of the year. The main drawback, however, is that the imagery is provided by a private company and therefore has a cost (but a cost much less than lidar).
Nevertheless, Planet provides a limited number of courtesy images for students and non-profit researchers, as part of the Education and Research Program [72], which was utilized for this research. A further advantage of satellite imagery is that a permit is not required to acquire the data, an often-difficult part of the process associated with obtaining lidar data. The study employed image sets from the Sentinel 2 constellation on 3 May 2021, and from Planet on 12 April of the same year. The sets were chosen due to the lack of clouds and cloud shadows (Figure 8). Table 2 summarizes the images used and their technical characteristics.

Figure 8. Multispectral visualizations for Aguada 259: (A) Planet RGB combination, (B) Planet NIR+G+B combination, (C) Sentinel 2 RGB combination, (D) Sentinel 2 NIR+G+B combination, (E) Sentinel 2 SWIR+G+B combination (spatial resolution: Sentinel 2 15 m, Planet 3 m).
Table 2. Sources of remote sensing information used in the study.
Nasa astronaut Don Pettit has shared a breathtaking near-infrared image of the Ganges River delta, captured from the International Space Station (ISS) during his Expedition 73 mission.
Posted on social media, Pettit’s image offers a rare, high-contrast perspective of the world’s largest river delta, dramatically highlighting its vast, fertile landscapes spanning parts of eastern India and Bangladesh.