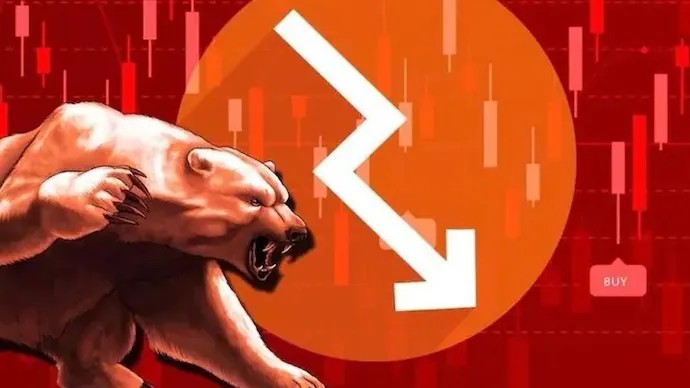
The BSE SENSEX index closed at 76,200.68, dropping 893.39 points (-1.16%). The Indian equity market experienced a sharp sell-off on Tuesday, June 23, 2026, as both domestic benchmarks plunged over 1.1%. The decline was triggered by a combination of global technology sector weakness, a crash in South Korean markets, and hawkish signals from the U.S. Federal Reserve. Sensex drops over 900 points:
Why is stock market falling today?
Dalal Street fell sharply on Tuesday as an Asian market selloff and weak IT shares dragged benchmarks lower. The decline has shifted focus to US rate signals, monsoon worries and fading momentum after the recent rally.
Seoul’s Kospi crashes 10%, Japan’s Nikkei falls 4%. Why are Asian markets down?
Asian markets tumbled as investors sold tech and AI stocks, with South Korea’s Kospi plunging 10% and Japan’s Nikkei falling 3.6%. Asian stock markets witnessed a sharp selloff on Tuesday, with South Korea’s benchmark Kospi index leading the decline after plunging nearly 10%, while Japan’s Nikkei 225 fell 3.6% as investors rushed to book profits in technology and artificial intelligence-linked stocks.
The sharp correction comes after months of strong gains across Asian markets, particularly in South Korea, where optimism around artificial intelligence, semiconductor companies and government-backed market reforms had pushed stocks to record highs.
But on Tuesday, sentiment turned decisively negative.
The Kospi suffered its worst single-day fall in years, triggering market-wide circuit breakers and raising concerns about whether Asia’s technology rally had run ahead of fundamentals.
WHY DID SOUTH KOREA’S KOSPI CRASH?
The biggest reason is simple: investors are taking money off the table after a spectacular rally.
South Korean stocks have been among Asia’s best performers this year, driven by gains in semiconductor giants, AI-related companies and hopes of shareholder-friendly reforms under the country’s new administration.
The benchmark index had surged to record highs before Tuesday’s correction.
When markets rise too quickly, even a small trigger can lead to aggressive profit booking as investors rush to lock in gains.
That appears to be exactly what happened.
TECH STOCKS LED THE SELLOFF
The correction was particularly severe in technology and semiconductor shares, which had been at the centre of Asia’s stock market rally. Investors have begun questioning whether valuations in some AI-linked stocks have become too expensive after months of relentless gains.
The mood was not limited to South Korea.
Japan’s Nikkei 225 fell 3.6%, while other Asian markets including Hong Kong and Taiwan also traded sharply lower as investors cut exposure to growth stocks.
The weakness mirrored a broader pullback in global technology shares after concerns emerged that the artificial intelligence trade may be losing momentum.
FED FEARS ARE BACK
Another factor weighing on markets is the outlook for US interest rates.
Investors increasingly believe the US Federal Reserve may keep interest rates higher for longer than previously expected.
Higher rates tend to hurt technology stocks because they reduce the present value of future earnings, which are often the main attraction for high-growth companies.
That has prompted investors globally to rotate out of expensive growth stocks and into more defensive sectors.
HAS THE AI RALLY PEAKED?
Not necessarily.
But markets are beginning to ask tougher questions.
For much of the past year, investors were willing to pay almost any price for companies linked to artificial intelligence, semiconductors and advanced computing.
Now, analysts say investors are becoming more selective.
The recent $600 billion wipeout in SpaceX’s market value over just three trading sessions has also highlighted growing concerns about lofty valuations in some of the market’s biggest AI-related names.
WHAT DOES THIS MEAN FOR INDIA?
The selloff is unlikely to leave Indian markets untouched.
A sharp correction in Asian equities often impacts investor sentiment globally and can lead to increased volatility in emerging markets, including India.
However, lower oil prices could provide some support to Indian equities by easing inflation concerns and reducing pressure on the country’s import bill.
For now, market participants will be closely watching whether Tuesday’s decline is merely a bout of profit booking or the beginning of a deeper correction in Asia’s technology-led rally.
The answer may depend on whether investors continue to believe that AI-driven earnings growth can justify the lofty valuations many technology stocks currently command.
Sensex
The Sensex (Stock Exchange Sensitive Index) is the benchmark stock index of the Bombay Stock Exchange (BSE) in India. It represents the 30 largest and most actively traded companies listed on the BSE, spanning diverse sectors such as finance, IT, energy, and consumer goods. These companies are selected based on their market capitalization, liquidity, and sector representation, making the Sensex a key indicator of India’s stock market performance.
Established in 1986, the Sensex serves as a barometer of investor sentiment and economic conditions in India. It is calculated using the free-float market capitalization method, which adjusts the weight of a stock based on the proportion of shares available for public trading.
Movements in the Sensex are influenced by factors like corporate earnings, government policies, global market trends, inflation, interest rates, and geopolitical events. A rising Sensex signals investor confidence and economic growth, whereas a decline may indicate market concerns. The decline comes after a strong seven-session rally that had lifted the Nifty by more than 1,800 points from its March lows, fuelled by easing tensions in West Asia, lower crude oil prices and moderating foreign investor outflows.
ASIAN MARKET SELLOFF HITS SENTIMENT
The biggest trigger for Tuesday’s decline was a broad selloff across Asian equity markets.
The MSCI Emerging Asia Index fell more than 4%, putting it on course for its worst session in over two weeks after touching a record high a day earlier.
South Korea’s KOSPI plunged 10%, marking its steepest fall since March, as investors rushed to book profits in technology stocks. Chipmaking giants Samsung Electronics and SK Hynix slumped more than 12% each.
Artificial Intelligence
Artificial Intelligence (AI) is a term you must be hearing everyday. From chatbots like ChatGPT to coding agents like Claude Code. But what is AI? AI has existed for decades. Artificial intelligence refers to the capability of computers to perform complex tasks, usually handled by humans – think data processing, and analysis.
However, in the past few years, AI has transformed, with the rise of Large Language Models (LLMs), such as Google Gemini. These LLMs can do a lot more than what AI did even a decade ago. From homework, assignments to even generating videos, and writing code. AI is everywhere now, and it is getting better too. To the extent that even companies are now relying heavily on AI tools for their tasks.
AI tools can not only help you be more productive, but sometimes, may be even better than you at doing certain tasks. That is not to say that AI is taking over, not yet anyway. Humans still remain the ones who bring new ideas and creativity, while AI can help us delegate our mundane everyday tasks. The weakness in Asian markets followed growing expectations that the US Federal Reserve could raise interest rates later this year under its new chairman Kevin Warsh. Markets are now pricing in a 75% chance of a rate hike by September.
Higher US rates generally make emerging markets less attractive for foreign investors and often trigger risk-off sentiment across global equities.
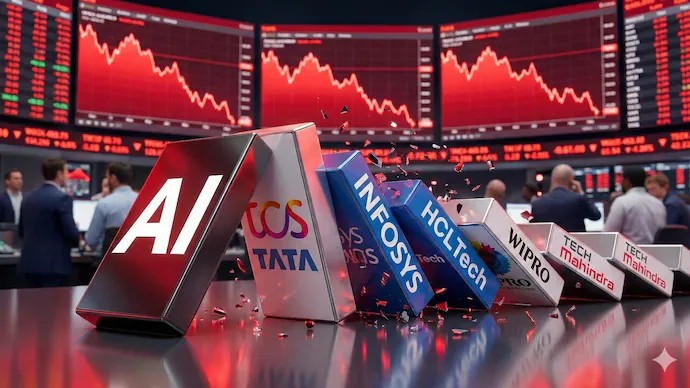
IT STOCKS LEAD THE FALL
Technology stocks emerged as the biggest drag on Indian markets.
The Nifty IT index slumped nearly 2%, making it the worst-performing sectoral index.
Among Sensex stocks, Infosys plunged 2.78%, TCS fell 2.94%, HCLTech dropped 1.38% and Tech Mahindra lost 1.61%.
The weakness in IT shares mirrors concerns seen across global technology stocks as rising US bond yields and expectations of tighter monetary policy threaten growth-oriented sectors.
Indian IT companies derive a significant portion of their revenues from the United States. A higher interest rate environment can slow technology spending by clients and weigh on future earnings growth.
METAL STOCKS ALSO UNDER PRESSURE
Apart from IT, metal stocks witnessed sharp selling.
The Nifty Metal index declined 3.39%, making it the second-worst performing sector of the day.
Tata Steel was among the biggest losers on the Sensex, falling 2.89%.
The selloff reflects concerns over global growth and demand after the sharp correction in Asian markets.
BROADER MARKET FEELS THE HEAT
The weakness was visible across market segments.
The Nifty 100 fell 0.85%, while the Nifty 200 dropped 0.85%.
The Nifty Midcap 100 declined 0.86% and the Nifty Midcap 50 lost 0.73%.
Smallcaps were relatively resilient but still traded lower, with the Nifty Smallcap 100 down 0.43%.
India VIX jumped 7.24%, indicating a rise in market nervousness.
FEW DEFENSIVE POCKETS HOLD FIRM
Not all sectors were under pressure.
Defensive segments such as healthcare and pharmaceuticals attracted buying interest.
The Nifty Pharma index rose 1.12%, while the Nifty Healthcare Index gained 0.77%.
Among Sensex constituents, Power Grid climbed 0.86%, Axis Bank rose 0.73% and Sun Pharma gained 0.71%.
WHAT ARE INVESTORS WORRIED ABOUT NOW?
According to Dr VK Vijayakumar, Chief Investment Strategist at Geojit Investments Limited, markets have already priced in much of the good news stemming from lower crude oil prices and improving prospects for peace in West Asia.
He noted that stability in the rupee and moderating foreign portfolio investor selling remain positives for the market.
However, he highlighted a new concern: the monsoon.
“The concern now is the poor monsoon, so far this season. The deficit now is huge at 42.2%. If the feared super El Nio leads to a sharp shortfall in monsoon, it can be negative for growth and inflation. Poor monsoon can impact rural demand and sectors like FMCG,” he said. Vijayakumar also pointed out that global investors will closely watch signals from the US Federal Reserve, as elevated inflation and rising bond yields continue to pose risks for equities worldwide.
HAS THE RALLY LOST STEAM?
Market experts believe Tuesday’s decline is partly a result of profit booking after a strong run-up in recent sessions.
While lower crude oil prices — Brent crude remains below $80 per barrel — continue to support India’s macroeconomic outlook, investors appear to be searching for fresh triggers after the recent rally.
For now, the combination of global market weakness, rising US rate expectations, concerns over the monsoon and selling in IT stocks has been enough to halt Dalal Street’s momentum.]
Market Summary
- BSE Sensex (INDEXBOM:SENSEX): Closed at 76,200.68, down 893.39 points (-1.16%).
Sensex Today Tanks 893 Points | Nifty Below 23,850 | 6 Reasons Why Indian Share Markets Are Falling

Although the benchmark indices opened flat, they traded negative throughout the session and ultimately closed red.
Indian equity benchmarks indices, Sensex and Nifty50 indices fell sharply, tracking heavy sell-off in metal, IT, and PSU bank stocks. Decline in global equities also exerted pressure on domestic equities.
List of BSE Sensex 30 Companies Here is the list of Sensex companies and how they impacted the movement in the index.
S&P BSE SENSEX Index (BSNX)
The Best Bluechip Stocks to Buy the 1990s, the fortunes of the Indian cricket team, rested on the shoulders of the star batsmen.
Be it Pataudi or Gavaskar or Tendulkar.
They were the stars who won matches. Without them the team fell like a pack of cards.
In the stock market, the fortunes of the Sensex and Nifty have come to rest on a few star performers over the years.
The bulk of investor money goes to them.
And investors firmly believe that only these stocks could create wealth over the long-term.
But the fact is the performance of index stocks will, at best, trail the index over the long-term.
If you are looking to make big gains in bluechips over the next decade, then you need to look beyond the Sensex stocks.
You see, a lot of the quality bluechips are not just restricted to the Sensex alone.
Here is the latest stock price and chart of 2.50% GOLD BONDS 2027 S I.
| Live BSE Quotes |
|---|
| Not listed |
| Live NSE Quotes | Jun 23, 2026 (Close) | ||
|---|---|---|---|
| Price (Rs)14,598.99 | Open (Rs)14,598.99 | High (Rs)14,598.99 | Low (Rs)14,598.99 |
| % Change1.02 | Volume2 | Value (Rs)29,198 | 52-Week H/L18,500.00 / 9,601.00 |
| Change | |||||
|---|---|---|---|---|---|
| 1 Day 1.02% | 1 Month -6.42% | 3 Months 11.45% | 1 Year 48.21% | 5 Years (CAGR)* 25.20% | |
* Compound Annual Growth Rate
2.50% GOLD BONDS 2027 S I Share Price Today:
2.50% GOLD BONDS 2027 S I last traded price was up 1.0% to Rs 14,599.0 on the NSE. The total volume of shares traded was 0.0 m.
NIFTY 50 Index (NIFTY)
| Live NSE Quotes | Jun 23, 2026 (Close) | ||
|---|---|---|---|
| Value23,824.10 | % Change-1.16 | 52-Week High26,373.20 | 52-Week Low22,182.55 |
| Change | |||||
|---|---|---|---|---|---|
| 1 Day -1.16% | 1 Month -0.86% | 3 Months 5.83% | 1 Year -4.60% | 5 Years (CAGR)* 8.72% | 10 Years (CAGR)* 11.16% |
* Compound Annual Growth Rate
Charts
| NIFTY 50 Index Chart (Rs) – Today09:0010:0011:0012:0013:0014:0015:0023,70023,80023,90024,00024,10024,200Zoom1d1w1m3m6mYTD1y3y5yAllFromJun 23, 2026ToJun 23, 2026 | ||
Advanced Charts new
NIFTY 50 Index
The NIFTY 50 Index was at 23,824.1 (down 1.2%).
CIPLA Share Price (CIPL)
CIPLA Quarterly Results
| No. of Mths Qtr. Ending | 3 Jun-24* | 3 Sep-24* | 3 Dec-24* | 3 Mar-25* | 3 Jun-25* | 3 Sep-25* | 3 Dec-25* | 3 Mar-26* | 8-Qtr Chart Click to enlarge | |
|---|---|---|---|---|---|---|---|---|---|---|
| Net Sales | Rs m | 66,939 | 70,510 | 70,730 | 67,297 | 69,575 | 75,894 | 70,745 | 65,412 | |
| Other income | Rs m | 1,602 | 1,906 | 2,216 | 2,895 | 2,586 | 2,690 | 2,063 | 1,482 | |
| Turnover | Rs m | 68,541 | 72,416 | 72,946 | 70,192 | 72,160 | 78,584 | 72,808 | 66,894 | |
| Expenses | Rs m | 49,781 | 51,654 | 50,841 | 51,921 | 51,793 | 56,947 | 58,194 | 55,442 | |
| Gross profit | Rs m | 17,158 | 18,856 | 19,889 | 15,376 | 17,781 | 18,948 | 9,792 | 9,970 | |
| Depreciation | Rs m | 2,467 | 2,717 | 2,798 | 3,087 | 2,527 | 2,970 | 2,784 | 4,249 | |
| Interest | Rs m | 180 | 154 | 146 | 140 | 141 | 132 | 140 | 131 | |
| Profit before tax | Rs m | 16,114 | 17,891 | 19,161 | 15,043 | 17,699 | 18,535 | 8,931 | 7,071 | |
| Tax | Rs m | 4,351 | 4,830 | 3,324 | 2,793 | 4,779 | 5,005 | 2,186 | 1,570 | |
| Profit after tax | Rs m | 11,763 | 13,060 | 15,837 | 12,250 | 12,921 | 13,531 | 6,746 | 5,501 | |
| Gross profit margin | % | 25.6 | 26.7 | 28.1 | 22.8 | 25.6 | 25.0 | 13.8 | 15.2 | |
| Effective tax rate | % | 27.0 | 27.0 | 17.3 | 18.6 | 27.0 | 27.0 | 24.5 | 22.2 | |
| Net profit margin | % | 17.6 | 18.5 | 22.4 | 18.2 | 18.6 | 17.8 | 9.5 | 8.4 | |
| Diluted EPS | Rs | 14.6 | 16.2 | 19.6 | 15.2 | 16.0 | 16.7 | 8.4 | 6.8 | |
| Diluted EPS (TTM) | Rs | 53.7 | 55.5 | 61.9 | 65.5 | 66.9 | 67.5 | 56.3 | 47.9 | |
* Results Consolidated
Interim results exclude extraordinary / exceptional items
Source: Accord Fintech, Equitymaster
CIPLA Share Price Performance
As of March 2026, company promoters held 29.21% stake in CIPLA, with no shares having been pledged.
Cipla Shareholding Pattern
| No. of Mths Qtr. Ending | 3 Jun-24 | 3 Sep-24 | 3 Dec-24 | 3 Mar-25 | 3 Jun-25 | 3 Sep-25 | 3 Dec-25 | 3 Mar-26 | |
|---|---|---|---|---|---|---|---|---|---|
| Indian Promoters | % | 10.88 | 10.89 | 9.16 | 9.16 | 9.16 | 9.17 | 9.17 | 9.17 |
| Foreign Promoters | % | 20.03 | 20.04 | 20.03 | 20.04 | 20.03 | 20.05 | 20.05 | 20.05 |
| Total Promoters | % | 30.91 | 30.92 | 29.19 | 29.20 | 29.19 | 29.21 | 29.21 | 29.21 |
| Mutual Funds | % | 17.62 | 17.48 | 20.46 | 20.51 | 20.44 | 20.23 | 19.21 | 18.66 |
| Financial institution/Banks/Insurance | % | 5.28 | 4.79 | 5.29 | 5.99 | 6.91 | 8.27 | 9.62 | 11.29 |
| Government | % | 0.00 | 0.00 | 0.00 | 0.00 | 0.00 | 0.00 | 0.00 | 0.00 |
| FII | % | 27.82 | 28.80 | 26.65 | 26.28 | 25.24 | 24.54 | 23.93 | 22.55 |
| Other | % | 1.97 | 1.81 | 1.88 | 1.64 | 1.91 | 1.75 | 1.88 | 2.02 |
| Total Institution | % | 52.69 | 52.88 | 54.28 | 54.42 | 54.50 | 54.79 | 54.64 | 54.52 |
| Bodies Corporate | % | 0.50 | 0.48 | 0.54 | 0.56 | 0.55 | 0.53 | 0.55 | 0.52 |
| Individuals | % | 14.24 | 14.16 | 14.29 | 14.13 | 14.09 | 13.83 | 13.84 | 13.98 |
| NRIs/OCBs | % | 0.88 | 0.86 | 0.99 | 1.07 | 1.05 | 1.05 | 1.14 | 1.15 |
| ADR/GDR | % | 0.00 | 0.00 | 0.00 | 0.00 | 0.00 | 0.00 | 0.00 | 0.00 |
| Others | % | 0.78 | 0.69 | 0.70 | 0.62 | 0.62 | 0.59 | 0.61 | 0.61 |
| Total Non-Institution | % | 16.40 | 16.19 | 16.52 | 16.38 | 16.31 | 16.00 | 16.14 | 16.26 |
| Total Public | % | 69.00 | 69.00 | 71.00 | 71.00 | 71.00 | 71.00 | 71.00 | 71.00 |
| Grand Total | % | 100.00 | 100.00 | 100.00 | 100.00 | 100.00 | 100.00 | 100.00 | 100.00 |
| Pledged Promoter Holding | % | 0.00 | 0.00 | 0.00 | 0.00 | 0.00 | 0.00 | 0.00 | 0.00 |
CIPLA Shareholding Trend
For the quarter ended March 2026, total promoters’ stake in CIPLA remained unchanged at 29.21%.
Meanwhile, mutual funds decreased their stake by 0.55%. As of March 2026, mutual funds held 18.66% stake in CIPLA.
Overall, institutional holding in CIPLA decreased by 0.12% and stood at 54.52% as of March 2026.
Here’s a table showing the largest shareholders in CIPLA.
Top Shareholders of CIPLA
| Shareholder’s name | Total Shares Held | Shareholding (%) | Quarter Ending |
|---|---|---|---|
| Yusuf Khwaja Hameid | 150,521,183 | 18.69 | Mar-26 |
| LICI NEW ENDOWMENT PLUS-SECURED FUND | 77,465,141 | 9.62 | Mar-26 |
| SOPHIE AHMED | 45,982,000 | 5.71 | Mar-26 |
| HDFC LARGE AND MID CAP FUND | 35,020,124 | 4.35 | Mar-26 |
| M K HAMIED | 27,844,320 | 3.46 | Mar-26 |
| SBI NIFTY 50 ETF | 23,859,595 | 2.96 | Mar-26 |
| ICICI PRUDENTIAL PHARMAHEALTHCARE AND DIAGANOSTIC | 19,324,659 | 2.40 | Mar-26 |
| DSP HEALTHCARE FUND | 14,307,255 | 1.78 | Mar-26 |
| PARAG PARIKH FLEXI CAP FUND | 13,594,444 | 1.69 | Mar-26 |
| NIPPON LIFE INDIA TRUSTEE LTD-A/C NIPPON INDIA ARB | 13,615,393 | 1.69 | Mar-26 |
Be it promoters, mutual funds, or foreign institutional investors (FIIs), there’s a lot of curiosity when these big names buy or sell stake.
CIPLA Dividend History
CIPLA paid a dividend of 650.00% for the year ended March 2026. The dividend payout per share of CIPLA was Rs 13.0.
Over the last 5 years, CIPLA has averaged a dividend of 555.00%. And the dividend per share has averaged Rs 11.0.
The end of year dividend yield of CIPLA is 1.06%.
The dividend payout ratio for the year was 27.14%.The 5 year average stands at 23.35%.
What about CIPLA’s peers?
In this group, the stocks to watch out for are SUN PHARMA, DIVIS LABORATORIES and TORRENT PHARMA.
| Live BSE Quotes | Jun 23, 2026 (Close) | ||
|---|---|---|---|
| Price (Rs)1,433.10 | Open (Rs)1,426.90 | High (Rs)1,461.25 | Low (Rs)1,420.00 |
| % Change1.26 | Volume650,484 | Value (Rs)943,933,919 | 52-Week H/L1,672.20 / 1,165.55 |
| Live NSE Quotes | Jun 23, 2026 (Close) | ||
|---|---|---|---|
| Price (Rs)1,433.10 | Open (Rs)1,422.80 | High (Rs)1,461.00 | Low (Rs)1,418.80 |
| % Change1.23 | Volume4,958,067 | Value (Rs)7,165,043,878 | 52-Week H/L1,673.00 / 1,165.70 |
| Change | |||||
|---|---|---|---|---|---|
| 1 Day 1.26% | 1 Month 1.39% | 3 Months 17.21% | 1 Year -4.35% | 5 Years (CAGR)* 8.39% | 10 Years (CAGR)* 11.65% |
* Compound Annual Growth Rate
Charts
Advanced Charts new
CIPLA Share Price Today:
CIPLA last traded price was up 1.3% to Rs 1,433.1 on the BSE. On the NSE, CIPLA last traded price was up 1.2% to Rs 1,433.1. The total volume of shares traded was 5.6 m.
Over the last 30 days, the 2.50% GOLD BONDS 2027 S I share price is down 7.0%.
The Search for the Next Infosys
INFOSYS Share Price (INFY)
| Live BSE Quotes | Jun 23, 2026 (Close) | ||
|---|---|---|---|
| Price (Rs)1,029.55 | Open (Rs)1,055.00 | High (Rs)1,055.00 | Low (Rs)1,026.10 |
| % Change-3.36 | Volume831,088 | Value (Rs)860,151,408 | 52-Week H/L1,727.85 / 1,026.10 |
| Live NSE Quotes | Jun 23, 2026 (Close) | ||
|---|---|---|---|
| Price (Rs)1,029.30 | Open (Rs)1,053.80 | High (Rs)1,055.30 | Low (Rs)1,026.00 |
| % Change-3.39 | Volume19,323,064 | Value (Rs)19,994,016,677 | 52-Week H/L1,728.00 / 1,026.00 |
| Change | |||||
|---|---|---|---|---|---|
| 1 Day -3.36% | 1 Month -11.90% | 3 Months -18.17% | 1 Year -35.03% | 5 Years (CAGR)* -7.29% | 10 Years (CAGR)* 5.45% |
* Compound Annual Growth Rate
| Valuation | ||||
|---|---|---|---|---|
| EPS (Rs)*72.64 | P/E Ratio (x)14.17 | Market Cap (Rs m)4,177,480.25 | P/BV (x)4.73 | Dividend Yield (%)4.66 |
| *Trailing 12 months earnings, excluding extraordinary / exceptional items. | BSE Sensex | CNX Nifty |
Charts
| INFOSYS Share Price Chart (Rs) – 1 YearJul ’25Sep ’25Nov ’25Jan ’26Mar ’26May ‘261,0007501,2501,5001,750Zoom1d1w1m3m6mYTD1y3y5yAllFromJun 23, 2025ToJun 23, 2026Jun 11, 2026INFOSYS: 1,114.00Volume |
The Infosys result was not an ordinary event. It was then a bellwether like no other. Its profits would literally lift the market mood.
The reverse was also true. If the company’s earnings guidance was not up to expectations, the market would fall.
There was good reason for this.
Lessons from past: The dot com bubble
‘The Florida real estate bubble’ which started in the early 1920s, when Florida entered a period of frenzied real estate speculation. The bubble lasted for almost a decade and ended as the Great Depression began. Today we will discuss about the bubble that arose around the turn of the millennium – the dot com bubble. The dot com bubble
The mid 1990s marked the beginning of a major growth of Internet users, who were viewed by companies as potential consumers. This prompted several entrepreneurs to venture into internet start-ups. These start ups came to be known as ‘dot coms’, as most of these companies had .com in their web addresses. At the pinnacle of the bubble many companies got engaged in unusual and risky business practices with the hopes of dominating their respective markets. Most of these dot com companies followed a policy of growth over profit. They assumed that if they built up their customer base, their profits would eventually rise. Investors responded to these risky business ventures with pots of money. With hundreds of companies being founded in a very short span of time, especially in tech hot spots like the Silicon Valley, the tech laden index NASDAQ rose dramatically during this time.
The euphoria was backed by the belief that internet business somehow would instantly take off and the entire business landscape will change in a very short span of time. However, no fundamental change was actually happening at the ground level. It was just wishful thinking on the part of companies that had no realistic business model to get these ideas off the ground.
The hype didn’t live up to its promises. Numerous high profile court cases regarding unscrupulous business practices started cropping up and the stock market began to tumble down. Unfortunately, the growth of the tech sector proved to be illusionary and dot com bubble burst in the year 2001. A decline in business spending combined with the market correction dealt a serious financial blow to many dot-com companies.
Conclusion
The internet caught the fancy of people in the 1990’s. This prompted many companies to promise life-altering changes. Though these ideas for change had a grain of truth in them, they were expected to deliver overnight instead of the decades they would actually require. The fundamentals of the dot com bubble were terrible. Most of the companies were not profitable and were having very risky business models. Some of them had no intention of ever making a profit. While the business model of these companies had no realistic way to turn a profit, their IPOs were skyrocketing just because of hype around them.
The burst of dotcom bubble once again highlighted the fact that the performance of a stock is dependent on performance of the company. As Peter Lynch says “I think you have to learn that there’s a company behind every stock, and that there’s only one real reason why stocks go up. Companies go from doing poorly to doing well or small companies grow to large companies.”
| COMPANY | INDUSTRY | MARKET PRICE(Rs) | CHANGE(%) | NO OF SHARES(m) | MARKET CAP.**(Rs m) | FREE FLOAT ADJ. FACTOR | WEIGHTAGE(%) | EARNINGS *(Rs m) | EPS(Rs) | PER(X) |
|---|---|---|---|---|---|---|---|---|---|---|
| ADANI PORTS & SEZ | MISCELLANEOUS | 1,783.1 | -2.4% | 2,304.0 | 4,108,189 | 0.3 | 1.4 | 125,244 | 54.4 | 32.8 |
| ASIAN PAINTS | PAINTS | 2,660.7 | -0.5% | 959.2 | 2,552,138 | 0.5 | 1.3 | 42,291 | 44.1 | 60.3 |
| AXIS BANK | BANKING | 1,362.6 | 0.3% | 3,110.4 | 4,238,075 | 0.9 | 4.2 | 264,938 | 85.2 | 16.0 |
| BAJAJ FINANCE | FINANCE | 962.3 | -0.6% | 6,226.0 | 5,991,236 | 0.5 | 2.9 | 193,159 | 31.0 | 31.0 |
| BAJAJ FINSERV | FINANCE | 1,765.2 | -1.0% | 1,600.6 | 2,825,291 | 0.4 | 1.3 | 196,530 | 122.8 | 14.4 |
| BHARTI AIRTEL | TELECOM | 1,901.1 | -0.8% | 6,094.4 | 11,586,051 | 0.5 | 6.4 | 334,583 | 54.9 | 34.6 |
| ETERNAL LTD | MISCELLANEOUS | 258.9 | -1.8% | 9,650.4 | 2,497,993 | 1.0 | 2.7 | 3,660 | 0.4 | 682.5 |
| HCL TECHNOLOGIES | SOFTWARE | 1,109.9 | -1.8% | 2,713.7 | 3,011,897 | 0.4 | 1.3 | 166,520 | 61.4 | 18.1 |
| HDFC BANK | BANKING | 774.5 | -1.5% | 15,400.8 | 11,927,927 | 1.0 | 12.9 | 792,195 | 51.4 | 15.1 |
| HINDUSTAN UNILEVER | FMCG | 2,159.8 | -1.2% | 2,349.6 | 5,074,530 | 0.4 | 2.1 | 105,970 | 45.1 | 47.9 |
| ICICI BANK | BANKING | 1,338.1 | -1.0% | 7,173.1 | 9,597,966 | 1.0 | 10.4 | 576,734 | 80.4 | 16.6 |
| INDUSIND BANK | BANKING | 905.1 | -1.9% | 779.1 | 705,154 | 0.8 | 0.6 | 8,892 | 11.4 | 79.3 |
| INFOSYS | SOFTWARE | 1,029.6 | -3.4% | 4,057.6 | 4,177,480 | 0.9 | 3.9 | 294,740 | 72.6 | 14.2 |
| ITC | FOOD | 289.9 | -0.5% | 12,529.5 | 3,632,293 | 1.0 | 3.9 | 206,411 | 16.5 | 17.6 |
| KOTAK MAHINDRA BANK | BANKING | 401.5 | -0.2% | 9,946.5 | 3,993,026 | 0.7 | 3.2 | 191,806 | 19.3 | 20.8 |
| L&T | ENGINEERING | 4,176.5 | -0.6% | 1,375.7 | 5,745,733 | 1.0 | 6.2 | 191,594 | 139.3 | 30.0 |
| M&M | AUTOMOBILES | 3,038.4 | -1.0% | 1,243.5 | 3,778,276 | 0.8 | 3.3 | 166,568 | 133.9 | 22.7 |
| MARUTI SUZUKI | AUTOMOBILES | 13,449.6 | 0.3% | 314.4 | 4,228,573 | 0.4 | 1.9 | 143,940 | 457.8 | 29.4 |
| NESTLE | FOOD | 1,392.3 | -0.7% | 1,928.3 | 2,684,696 | 0.4 | 1.1 | 35,446 | 18.4 | 75.7 |
| NTPC | POWER | 364.7 | -0.6% | 9,696.7 | 3,536,374 | 0.5 | 1.9 | 271,459 | 28.0 | 13.0 |
| POWER GRID | POWER | 292.3 | 0.8% | 9,300.6 | 2,718,101 | 0.5 | 1.4 | 188,347 | 20.3 | 14.4 |
| RELIANCE IND. | ENERGY | 1,309.3 | -1.3% | 13,532.5 | 17,718,153 | 0.5 | 9.6 | 956,100 | 70.7 | 18.5 |
| SBI | BANKING | 1,024.0 | -1.6% | 9,230.6 | 9,452,152 | 0.4 | 4.5 | 851,685 | 92.3 | 11.1 |
| SUN PHARMA | PHARMACEUTICALS | 1,867.8 | 0.2% | 2,399.3 | 4,481,478 | 0.5 | 2.2 | 115,645 | 48.2 | 38.8 |
| TATA MOTORS PASSENGER VEHICLES LIMITED | AUTOMOBILES | 354.6 | -1.9% | 3,682.6 | 1,305,844 | 0.6 | 0.8 | -4,430 | -1.2 | – |
| TATA STEEL | STEEL | 193.7 | -2.7% | 12,483.5 | 2,417,421 | 0.7 | 1.7 | 105,173 | 8.4 | 23.0 |
| TCS | SOFTWARE | 2,060.2 | -3.2% | 3,618.1 | 7,453,803 | 0.3 | 2.3 | 494,540 | 136.7 | 15.1 |
| TECH MAHINDRA | SOFTWARE | 1,415.3 | -1.4% | 980.1 | 1,387,076 | 0.7 | 1.0 | 48,070 | 49.0 | 28.9 |
| TITAN | RETAILING | 4,305.5 | -1.5% | 887.8 | 3,822,319 | 0.5 | 1.9 | 50,730 | 57.1 | 75.3 |
| ULTRATECH CEMENT | CEMENT | 11,310.8 | -0.8% | 294.7 | 3,333,057 | 0.4 | 1.5 | 82,042 | 278.4 | 40.6 |
| TOTAL | 155,863 | 149,982,303 | 100.0 | 7,200,582 | AVG. PER | 20.8 | ||||
* Earnings for last 4 quarters on rolling basis, excluding extraordinary / exceptional items. ** Indicates total market cap. (and not free float). The weightage is calculated on a free float basis.
Sensex Sensitivity
Calculation of market indices has been an enigma for most investors. Our calculator aims at arming investors with a tool that lets them determine how, or rather which stocks have actually contributed to the day’s happenings. And that too in quantitative terms. The tool is simple to use. Just select a company, indicate the price movement and click the ‘then…’ button. The output boxes give the contribution of the stock to the change in the index. This was the trend for years. Infosys kept outdoing itself in terms of profitability and creating stock market wealth.
IT Sector Analysis Report
- India’s software industry can be divided into four main segments – IT services, Business Process Management, Software Products and Engineering Services, and Hardware. IT Services account for 51% of the total revenue of the sector, with BFSI (Banking, Financial Services and Insurance) being the key vertical.
- UK and US are the leading consumer markets for the sector with a combined share of 80%. However, there is a growing demand from APAC, Latin America, and Middle East Asia regions. Indian companies have setup over 1000 global delivery centers in about 80 countries over the world to cater to the respective local markets.
- India has a low-cost advantage. IT services in India is cost a fraction (about 20%) of what they cost in the United States, which makes India a preferred destination for IT sourcing. India accounts for approximately 55% market share of the US$ 200-250 billion global services sourcing business.
- Social media, Mobility, Analytics, and Cloud Computing (SMAC) is leading digitization of the entire business model of the sector. Export revenue from the digital segment already forms about 20% of the industry’s total export revenue.
- Large players with a wider range of capabilities are gaining ground as they move from being simple maintenance providers to full service players, offering infrastructure, system integration and consulting services. Of the total revenue, about 80% is contributed by 200 large and medium players.
- The software sector is also gradually moving from linear business models to non-linear ones. Indian companies are focusing on newer models such as platform based services and creation of intellectual property.
- The Indian government is emphasizing on better technology enabled delivery mechanisms for a multitude of government projects. With initiatives such as Digital India and Start Up India being launched, the domestic market for software services has a bright future ahead.
HOW TO RESEARCH THE IT SECTOR (KEY POINTS)
- Supply
- Abundant supply of IT Services across segments, mainly lower-end (maintenance). Lower supply of services in higher-end areas such as analytics and cloud computing but competition is very tough.
- Demand
- High. IT services have seen a remarkable shift in demand in the last few years, with an ever-increasing share of digital, cloud, cyber security offerings and application services.
- Power of Suppliers
- Low, as a large supply of human resource is available at low cost from around the world.
- Power of Buyers
- Medium. The bigger IT companies enjoy the advantage of high switching costs. Once a client selects a particular IT company as its partner, it becomes dependent on the company for all its upgrades and technology requirements making it difficult to switch.
- Barriers to entry
- Low, as setup cost is almost negligible. However, it is high in value-added services where in-domain expertise can create a barrier. The size of a particular company and brand-image also creates barriers to entry, as such firms have built long-term relationships with major clients.
- Competition
- High, as the competition is global in nature and stretches across boundaries and geographies. It is expected to intensify due to the attempted replication of the Indian offshoring model by MNC IT majors as well as small startups.
- Threat of Substitutes
- Medium. Certain countries like China, Taiwan and Korea have started to develop an environment required for growth of the IT sector. Indian companies need to innovate to have an edge over the others.
Financial Year ’23
- According to NASSCOM, the revenue for the Indian IT services’ sector grew 8.3% YoY in FY23, led by IT modernization, cloud migration and platformization. Digital revenues accounted for 32%-34% of total industry revenue, growing at 16% annually.
- IT services contracts included a significant digital component, led by digital transformation, cloudification, platform engineering, AI, building software-as-a-service (“SaaS”) enabled products and associated consulting services.
- Next-generation technologies, such as sensor technology, smart robots, autonomous driving, computer vision, deep learning, autonomous analytics, AR/VR, sustainability technology, edge computing, distributed ledger, spacetech and 5G/6G witnessed twice the average growth.
- Industry verticals such as banking & financial services, hi-tech, and retail & consumer showed signs of caution in their technology spending in response to financial market instabilities, cost pressures, lingering inflation, and weak consumer spending.
- Telecom prioritized monetizing their 5G investments while verticals such as healthcare, utilities, automotive were the bright spots and stayed resilient.
- In FY23, the government of India and the Indian public sector enterprises spent approx. US$9.5 billion on technology with an increased focus on cloud, with an additional investment of US$ 2-3 billion in cloud alone.
- In November 2022, Amazon Web Services announced the launch of its second AWS infrastructure region in India – the AWS Asia Pacific (Hyderabad) Region. By 2030, it is anticipated that the region will support more than 48,000 full-time jobs annually thanks to investments totaling more than US$ 4.4 billion in India.
- New-age technologies were adopted across various industries, and India’s central and state governments are expected to invest $2-3 billion more in these technologies.
- As per the Union Budget, as well as updates to India’s data protection laws, the government continues to encourage investment in data centers with the intent to make India a data center hub.
- The computer software and hardware sector in India attracted cumulative foreign investment (FDI) inflows worth US$ 97.31 billion between April 2000-September 2023. The sector ranked second in FDI inflows as per the data released by the Department for Promotion of Industry and Internal Trade (DPIIT). Computer software and hardware make up 15% of the cumulative FDI inflows.
Prospects
- Domestic growth of the IT sector is expected to be driven by increasing adoption of technology and telecom by consumers in rural areas.
- Tier II and Tier III cities provide opportunities to IT companies aiming to establish their business in India. Cheap labour, affordable real estate, favorable government regulations, tax breaks and SEZ schemes are facilitating the emergence of these cities as new IT destinations.
- Small and medium sized businesses have an IT spend of approximately US$ 230-250 billion, but contribute just 25% to India’s IT revenue. The emergence of new service offerings and business models would aid in tapping this segment profitably and efficiently.
- IT Sophistication in the utilities segment and the need for standardization of the process are also expected to drive demand for the sector.
- As digital technologies transform business models around the globe, enterprises will increase their technology spending. Investments in digital, analytics, cloud, internet of things (IoT), cybersecurity and other emerging technologies is expected to grow exponentially.
- Technologies such as telemedicine, health, remote monitoring solutions and clinical information monitoring systems will also continue to boost demand.
- The rollout of the fifth generation (5G) wireless technology by telecommunications companies is expected to bring at least US$ 10 billion global business to Indian IT firms by 2025.
- The Government has extended tax holidays to the IT sector for Software Technology Parks of India (STPI) and Special Economic Zones (SEZs) and has set up a more liberal system for raising capital, seed money and ease of doing business which will support growth of the sector.
- Emerging geographies would drive the next phase of growth for the software sector in India. A focus on building a local credible presence, high degree of domain expertise at competitive costs and operational excellence holds the key to success in these new geographies.
The Best Bluechip Stocks to Buy
Track Daily Market Performance
- Market Open: Started the session at 77,086.05.
- Intraday High: Peaked during early hours at 77,194.83.
- Intraday Low: Bottomed out late day at 76,082.51.
- Previous Close: Stood firmly at 77,094.07.
- 52-Week Range: Spans between 71,545.81 and 86,159.02.
BSE Sensex Share Price Today
As on 23 Jun 2026, the BSE Sensex is trading at ₹76200.68, down by 1.16% from the previous close of ₹77094.07. The index opened at ₹77,086.05, touched an intraday high of ₹77194.83 and a low of ₹76082.51. Over the past 52 weeks, it has moved between a low of ₹71545.81 and a high of ₹86159.02.
BSE Sensex Performance
Today’s Low – High
76,082.51
77,194.83
52 Week Low – High
71,545.81
86,159.02
Open
77086.05
Prev. Close
77094.07
1W Return
▼-0.79%
1M Return
▲1.04%
6M Return
▼-10.90%
1Y Return
▼-6.96%
3Y Return
▲20.99%
BSE Sensex Stock List
| Company | Market Cap |
|---|---|
| Infosys Ltd | 4,32,260.04 |
| Tata Consultancy Services Ltd | 7,69,675.76 |
| Bharat Electronics Ltd | 3,15,380.41 |
| Tata Steel Ltd | 2,48,359.77 |
| Adani Port and Special Economic Zone Ltd | 4,20,990.93 |
Rows per page:51025
1-5 of 30
What is BSE Sensex?
The BSE Sensex (INDEXBOM: SENSEX), officially known as the S&P BSE Sensex, is India’s oldest and most respected stock market index, launched in 1986 by the Bombay Stock Exchange (BSE). The term “Sensex” is derived from “Sensitive Index” and it represents the performance of 30 of the largest, most financially sound, and most actively traded stocks listed on the BSE. These companies come from diverse sectors, including finance, IT, energy, healthcare, and consumer goods, offering a comprehensive snapshot of the Indian economy’s health and market sentiment.
The Sensex serves as a bellwether for the Indian equity market, widely tracked by investors, analysts, and fund managers both in India and internationally. Its movements reflect the collective performance of the selected blue-chip companies, making it a crucial benchmark for portfolio performance comparison and investment decisions. The Sensex is also the foundation for various investment products, including mutual funds, exchange-traded funds (ETFs), and derivatives. Regularly reviewed to maintain its relevance, the Sensex’s composition changes as per the evolving market landscape, ensuring that only the most significant and representative companies are included. The index is calculated in real-time throughout market hours, providing immediate updates on market direction.
How is BSE Sensex calculated?
The BSE Sensex is calculated using the free-float market capitalisation-weighted methodology, which ensures that only shares that are readily available for trading by the general public impact the index’s value.
- The free-float market capitalisation for each of the 30 constituent companies is determined by multiplying the company’s share price by the number of shares available in the market (excluding promoter and locked-in shares) and then by the company-specific free-float factor.
- The sum of these free-float market capitalisations for all constituent stocks gives the total free-float market capitalisation of the Sensex.
- This total is then divided by a fixed “Index Divisor”, which normalises the index value to a base period (1978-79, with a base value of 100).
- The divisor is adjusted periodically for corporate actions like stock splits, rights issues, or new inclusions to ensure continuity and comparability over time.
- The Sensex value thus reflects real-time movements in the free-float market capitalisation of its 30 companies, capturing market trends and investor sentiment.
- Updates are made every few seconds during trading hours, making Sensex a highly dynamic and reliable indicator for the Indian equity market.
Selection criteria for BSE Sensex
The selection of companies for inclusion in the BSE Sensex is based on strict and transparent criteria. Companies must be listed on the Bombay Stock Exchange and should rank among the top stocks in terms of average daily market capitalisation and traded value over the last six months. They must also have a high liquidity, demonstrated by a significant trading frequency and volume. Only those companies with a minimum listing history of six months are eligible, except in cases of large-cap IPOs that qualify based on size and trading activity. Additionally, the Sensex aims to represent a diverse range of sectors to provide a balanced view of the Indian economy. The index is reviewed semi-annually, and changes are made to ensure it continues to represent the most influential and widely held stocks in the market.
Analyze the Market Decline
- Asian Spillovers: South Korea’s KOSPI plunged 10%, hurting technology sectors.
- Domestic Drag: Major losses originated within IT and metal sectors.
- Macro Headwinds: Sluggish monsoons and high US interest rates weighed.
- Top Decliners: Technical heavyweights Infosys and TCS shed over 3%.
Understand the Index Fundamentals
- Structure: Comprises 30 financially sound blue-chip companies.
- Methodology: Weighted using a free-float market capitalisation technique.
- Top Weights: Driven by Reliance Industries, HDFC Bank, and Airtel.
- Role: Serves as the primary pulse of Indian equities.