According to the IMD’s latest bulletin, thunderstorms accompanied with lightning and gusty winds are very likely to occur at isolated places in 11 districts of Telangana Commuters move during rain in Secunderabad on June 12, 2026.
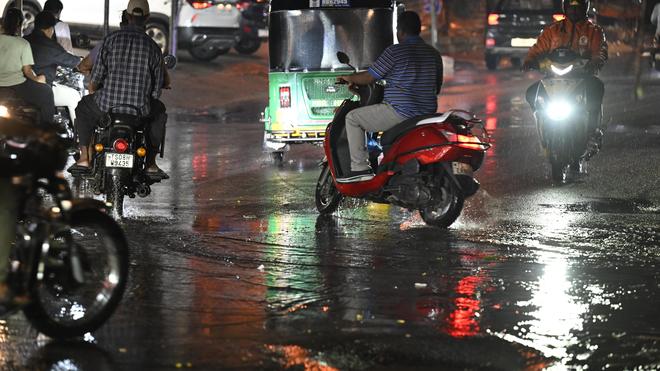
The India Meteorological Department (IMD) has issued a thunderstorm forecast in 11 Telangana districts for Sunday (June 14, 2026). According to the IMD’s latest bulletin, thunderstorms accompanied with lightning and gusty winds are very likely to occur at isolated places in Mahabubnagar, Nagarkurnool, Wanaparthy, Narayanpet, Jogulamba Gadwal, Mulugu, Bhadradri Kothagudem, Khammam, Nalgonda, Suryapet and Mahabubabad districts.
Elsewhere, after the successful trial run and subsequent operationalisation of the Cell Broadcast system, a mobile-based disaster warning system introduced by the Union Government, the Centre has suspended Cell Broadcast Services from June 12 without citing any specific reasons. An order issued by the National Disaster Management Authority (NDMA) on June 12 stated that, due to certain issues flagged by the competent authorities, the Cell Broadcast Service is being kept on hold until further instructions.
June 13, 2026 20:06Cyberabad police on alert amid heavy rainfall, waterlogging concernsCyberabad police on alert amid heavy rainfall, waterlogging concernsIn view of ongoing rains, special teams have been stationed at major junctions, high-traffic corridors and areas vulnerable to waterlogging to regulate vehicular movement and prevent congestion across Cyberabad.Personnel from the law and order and traffic wings have been working on the ground to ensure smooth movement of vehicles and assist commuters and ensure public safety, particularly in low-lying and waterlogged areas. Police teams are alerting the public to potential hazards and advising them to avoid entering inundated stretches and other risky locations.Cyberabad police on alert amid heavy rainfall, waterlogging Concerns cyberabad police on alert amid heavy rainfall, waterlogging concerns June 13, 2026 07:44Delhi | Coolest June day so far recorded as rain, storms bring relief from heatRain and thunderstorm activity brought temperatures down sharply across Delhi on June 12, making it the coolest day of June so far, while the India Meteorological Department (IMD) has forecast more thunderstorms, rain and gusty winds through today.The maximum temperature at Safdarjung, the city’s base station, settled at 34.6 degrees Celsius, 5.3 degrees Celsius below normal and 4.1 degrees Celsius lower than the previous day. The minimum temperature was recorded at 22.8 degrees Celsius, 5.2 degrees Celsius below normal and 7.2 degrees Celsius lower than a day earlier.
June 13, 2026 07:43Delhi |
IMD issues red alert for thunderstorms, lightningDelhi has been placed under a red alert for last night as the India Meteorological Department (IMD) warned of moderate thunderstorms, lightning and squally winds reaching 60-70 kmph, gusting up to 80 kmph, across the city.The weather office said that very light to light rain is likely at most places, while isolated areas may receive moderate rainfall.A red alert signifies the need to take action and follow safety advisories issued by authorities.
June 13, 2026 09:53
Delhi | Sunny morning in the national capital, rain likely
It was a sunny morning in the national capital today and the minimum temperature settled at 21.4 degrees Celsius, 6.6 notches below the season’s average, officials said.
The India Meteorological Department (IMD) has forecast thunderstorms accompanied by rain and gusty winds today and Tomorrow. The maximum temperature today is expected to settle around 37 degrees Celsius.Humidity levels stood at 77% at 8.30 a.m.
June 13, 2026 10:54
Read Editorial | On India and the southwest monsoon
The southwest monsoon reached Kerala on June 4, three days past its normal date and four days behind the India Meteorological Department’s own forecast. This is the first time since 2015 that the agency has misjudged the onset beyond its margin of error. A late arrival, in itself, is no calamity. The date on which the rains touch the Kerala coast has little statistical bearing on how much falls over the four months that follow.
June 13, 2026 11:03
Tamil Nadu | Upper air cyclonic system to bring rains to several districts
An upper air cyclonic circulation over north coastal Tamil Nadu is expected to bring heavy rains to several districts in the State.
According to the Regional Meteorological Centre in Chennai, heavy rain accompanied by thunderstorm, lightning and gusty winds reaching speed upto 40-50 kmph is likely at isolated places over Salem, Tiruvannamalai, Kallakurichi, Kanyakumari and ghat areas of Tirunelveli districts.
Accordingly, the maximum temperature is expected to drop by two degree celsius in Tamil Nadu, Puducherry and Karaikal areas.
June 13, 2026 12:06
Kerala | Three northern districts on yellow alert
Isolated heavy rainfall is likely to continue over a few districts in Kerala over the weekend, an India Meteorological Department (IMD) update on the southwest monsoon rainfall indicated yesterday.
Kozhikode, Kannur, and Kasaragod are on yellow alert for isolated heavy rainfall today. Pathanamthitta, Kottayam, Ernakulam, Idukki, and Thrissur are on yellow alert tomorrow. All other districts can expect light to moderate rainfall on the two days.
Trend Shift: The forecast signals a likely end to two consecutive years (2024–25) of above-normal rainfall.
- Drought: IMD classifies rainfall below 90% of LPA as “deficient,” often associated with drought conditions.
| Long Period Average is the average rainfall calculated over a long period (30 or 50 years), used as a benchmark to assess monsoon performance. |
Impacts of Below-Normal Monsoon
- Agricultural Stress: ~60% farmers dependent on the monsoon face risk to Kharif crop productivity.
- Income Shock: Poor rainfall can reduce rural incomes and weaken consumption demand.
- Water Scarcity: Deficient rainfall can reduce groundwater recharge and drinking water availability.
- Energy Impact: Lower reservoir levels may affect hydropower generation.
- Food Inflation: Reduced crop output can push up food prices and inflation.
Climatic Drivers of Monsoon in India
- Snow Cover Impact: Lower Eurasian snow cover is associated with a stronger monsoon, whereas higher snow cover weakens it.
- Walker Circulation: Changes in east–west atmospheric circulation influence moisture transport and monsoon intensity.
- Both the Northern and Southern hemispheres have jet streams, although the jet streams in the north are more forceful due greater temperature gradients.
Permanent jet streams
There are two permanent jet streams – subtropical jets at lower latitudes and polar front jets at mid-latitudes.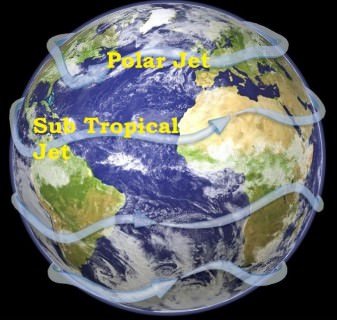
Subtropical jet stream (STJ)
The sub-tropical jet stream is produced by the earth’s rotation (Coriolis force) and temperature contrast between tropical and sub – tropical regions.
At the equator, the rotation produces greatest velocity in the atmosphere.
As a result, the rising air which spreads out northwards and southwards, moves faster than the latitudes over which it is blowing.
It is deflected to the right in the northern hemisphere and to the left in the southern hemisphere, and at about 30° latitude, it becomes concentrated as the subtropical jet streams.
During winter, the STJ is nearly continuous in both hemispheres. The STJ exists all year in the southern hemisphere. However, it is intermittent in the northern hemisphere during summer when it migrates north.
The STJ can be temporarily displaced when strong mid-latitude troughs extend into subtropical latitudes. When these displacements occur, the subtropical jet can merge with the polar front jet (Related to Cloudbursts. We will study this in Indian Monsoons).
STJ is closely connected to the Indian and African summer monsoons (We will study this in Indian Monsoons)
Polar front jet (PFJ)
The polar front jet is produced by a temperature difference and is closely related to the polar front (more about fronts later).
It has a more variable position than the sub-tropical jet. In summer, its position shifts towards the poles and in winter towards the equator.
The jet is strong and continuous in winter.
It greatly influences climates of regions lying close to 60 degree latitude.
It determines the path and speed and intensity of temperate cyclones.
Temporary jet streams
While the polar and subtropical jet streams are the best known and most studied, other jet streams can form when wind speeds are above 94 kph in the upper atmosphere at about 9 – 14.5 km above the surface.
They are few. Important ones are Somali Jet and The African Easterly jet.
The Tropical Easterly Jet or African Easterly Jet
There are also major high velocity winds in the lower troposphere called low-level jets (LLJs). In the tropics, the most prominent of these are the Somali Jet and the African Easterly Jet.
The TEJ is a unique and dominant feature of the northern hemispheric summer over southern Asia and northern Africa. The TEJ is found near between 5° and 20°N.
It is fairly persistent in its position, direction, and intensity from June through the beginning of October.
During the south Asian summer monsoon, the TEJ induces secondary circulations that enhance convection over South India and nearby ocean.
The establishment and maintenance of the TEJ is not fully understood but it is believed that the jet may be caused by the uniquely high temperatures and heights over the Tibetan Plateau during summer.
The TEJ is the upper-level venting system for the strong southwest monsoon.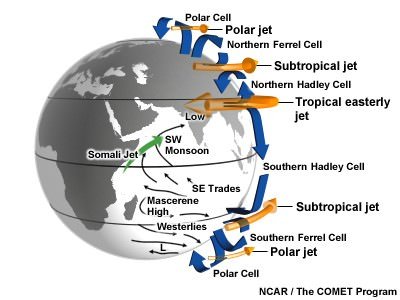
The Somali Jet
Among the most well-known of the tropical LLJs is the Somali Jet, a southwesterly
The Somali jet occurs during the summer over northern Madagascar and off the coast of Somalia. The jet is most intense from June to August.
It is a major cross-equatorial flow from the southern Indian Ocean to the central Arabian Sea.
A split in the axis of the jet over the Arabian Sea, the more northern branch intersecting the west coast of India near 17°N, while the southerly branch moves eastward just south of India.
The jet remains relatively steady from June to September before moving southward to the southern Indian Ocean during the winter.
Influence of Jet Streams on Weather
Jet streams help in maintenance of latitudinal heat balance by mass exchange of air.
PFJ influence the mid-latitude weather disturbances. Usually there are severe storms when jet streams interfere with surface wind systems.
Jet streams also influence the path of temperate cyclones. They have an influence on distribution of precipitation by the temperate cyclones.
Sub-tropical jet stream and some temporary jet streams together influence Indian Monsoon patterns. (more about this while studying India Monsoons in Indian geography)
Jet streams also exercise an influence on movement of air masses which may cause prolonged drought or flood conditions.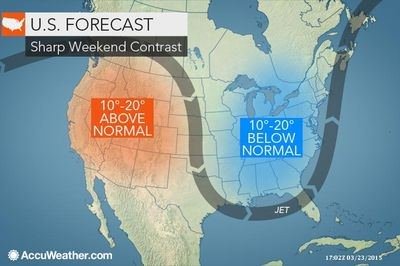
Jet Streams and Weather in Temperate Regions
How does jet streams affect the weather in temperate regions?
PFJ play a key role in determining the weather because they usually separate colder air and warmer air.
Jet streams generally push air masses around, moving weather systems to new areas and even causing them to stall if they have moved too far away.
PFJ play a major role in determining the path and intensity of frontal precipitation and frontal cyclones or temperate cyclones.
Weak PFJ also results in slipping of polar vortex into temperate regions. (More later)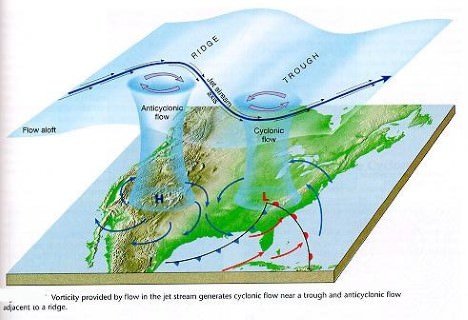
Explanation
Polar jet has distinct peaks (ridges) and troughs.
Ridges occur where the warm air (at high pressure) pushes against the cold air.
Troughs occur where cold air (at lower pressure) drops into warm air.
This condition occurs due to weak jet stream which is weak due to lesser temperature contrast between sub-tropics and temperate region.
These ridges and troughs give rise to jet streaks which are the main reason behind cyclonic and anticyclonic weather conditions at the surface.
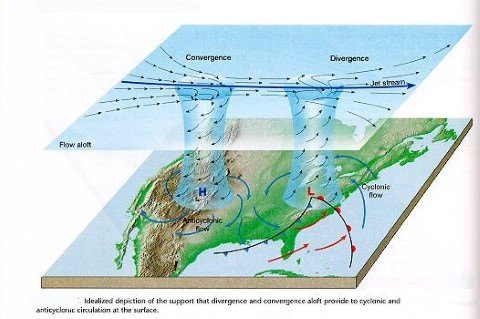
The winds leaving the jet streak are rapidly diverging, creating a lower pressure at the upper level (Tropopause) in the atmosphere. The air below rapidly replaces the upper outflowing winds. This in turn creates the low pressure at the surface. This surface low pressure creates conditions where the surrounding surface winds rush inwards. The Coriolis effect creates the cyclonic rotation that is associated with depressions.
The winds entering the jet streak are rapidly converging, creating a high pressure at the upper level (Tropopause) in the atmosphere. This convergence at upper troposphere leads to divergence (high pressure) at the surface (anticyclonic condition).
The Coriolis effect creates the anticyclonic rotation that is associated with clear weather.
Jet Streams and Aviation
Jet streams are used by aviators if they have to fly in the direction of the flow of the jet streams, and avoid them when flying in opposite direction.
Jet streams can also cause a bumpy flight, because the jet stream is sometimes unpredictable and can cause sudden movement, even when the weather looks calm and clear.
During volcanic eruptions plumes of volcanic ash have a tendency to get sucked into the same jet stream that airplanes use for travel.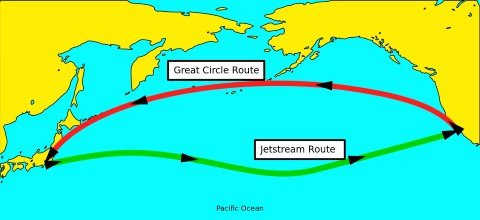
Jet streams on other planets
Other planets have jet streams as well, notably Jupiter and Saturn.
- Global Warming: Climate change alters moisture availability and increases variability, causing extreme rainfall events.
How the Two Weather Giants Clash
The interaction between these two oceanic systems determines the fate of the Indian monsoon:
The Pacific Threat (Global El Niño): This phenomenon involves the unusual warming of the central and eastern Pacific Ocean. It weakens the trade winds that normally pull moisture-laden air toward South Asia, traditionally causing prolonged heatwaves, delayed monsoons, and widespread drought in India.
What The 2026 El Niño Means For India climate pattern could potentially weaken an already below-normal monsoon this year, which could have cascading effects on weather, agriculture and inflation its monsoon forecast to 90% of the long-period average as against the earlier 92%, and forecast a warmer June.
One reason will be an ‘El Niño’ brewing in the Pacific Ocean that can lead to a weak monsoon.
Mumbai: After a season of intense heatwaves, India will not have a lot of respite this monsoon, with the India Meteorological Department (IMD) forecasting a ‘below normal’ monsoon season.
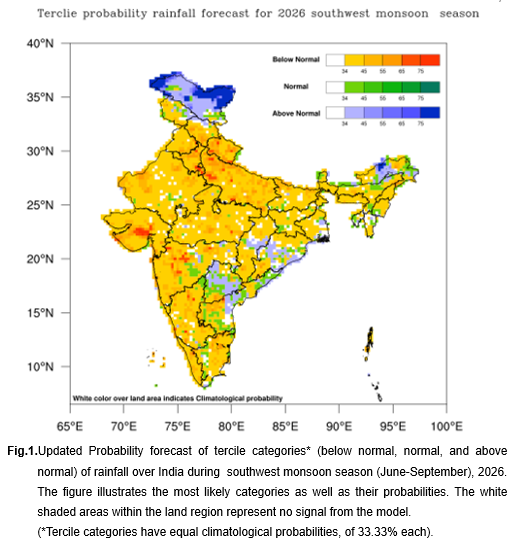
IMD releases Updated Long Range Forecast for the Southwest Monsoon Seasonal Rainfall a) The southwest monsoon seasonal rainfall over country as a whole is likely to be 90% of Long Period Average (LPA) with a model error of ±4%, indicating that below normal rainfall over the country as a whole during the monsoon season (June to September), 2026. b) Southwest monsoon seasonal (June to September, 2026) rainfall is most likely to be normal over Northeast India (94-106% of LPA) and below normal over Central & South Peninsular India (<94% of LPA) and Northwest India (<92% of LPA). c) The southwest monsoon seasonal rainfall over Monsoon Core Zone (MCZ) is most likely to be below normal (<94% of LPA). d) During June to September 2026, below-normal seasonal rainfall is most likely over most parts of the country, except some areas over Northwest and northeast India, eastern parts of south peninsula and adjoining areas of east-central India and isolated pockets of East India, where normal to above normal rainfall is likely. e) Average rainfall for country as a whole during June 2026 is most likely to be below normal (<92% of LPA). f) During June 2026, below normal monthly rainfall is very likely over most parts of the country, except over some parts of NorthwestIndia, Northeast India and south Peninsula and isolated pockets of central India where normal to above normal rainfall is likely. g) In June 2026, above normal monthly maximum temperatures are likely over most parts of the country, except some parts of Central, Northwest and East India, where normal to below normal maximum temperatures are very likely. Above-normal monthly minimum temperatures are likely across most parts of the country, except some parts of Northwest, Central and adjoining south Peninsular India where, where normal to below-normal minimum temperatures are very likely.
One reason will be an ‘El Niño’ brewing in the Pacific Ocean that can lead to a weak monsoon. Warning of record global temperatures as chance of very strong El Niño grows new forecasts show increasing confidence that the developing El Niño in the tropical Pacific Ocean could be one of the strongest on record with warnings of record global temperatures and huge humanitarian impacts.
Parts of the Pacific have been warming rapidly with data this week showing sea surface temperatures around 0.5C above normal – one threshold used to suggest the onset of El Niño, a natural warming of the Pacific.
It is expected to strengthen over the next few months, peaking potentially as a very strong – or so-called super El Niño – in the autumn.
Scientists are concerned about the consequences it could have on global weather patterns, including the likelihood of 2027 being the warmest year on record.
In their latest outlook, the National Oceanographic and Atmospheric Administration (NOAA) suggest El Niño will begin within the month.
They have increased the confidence to a two-in-three chance that it will be strong or even very strong by this winter.
The rate of warming seen in the tropical Pacific over the last few weeks has been rapid.
Nathanial Johnson, a meteorologist at NOAA described it as a “rare occurrence” should it continue at the current pace – going from the La Niña (a similar cooling pattern) we saw in winter to a potentially strong El Niño, within a year.
The Bureau of Meteorology (BoM) in Australia also forecasts El Niño using a slightly stricter criterion where sea surface temperatures in the tropical Pacific must exceed 0.8C above average.
They also look for indications that the trade winds in the western Pacific have reversed; signalling that the warming ocean is beginning to influence the atmosphere.
Spring forecasts of El Niño have historically been quite poor, but forecasters have been much more confident than normal this year.
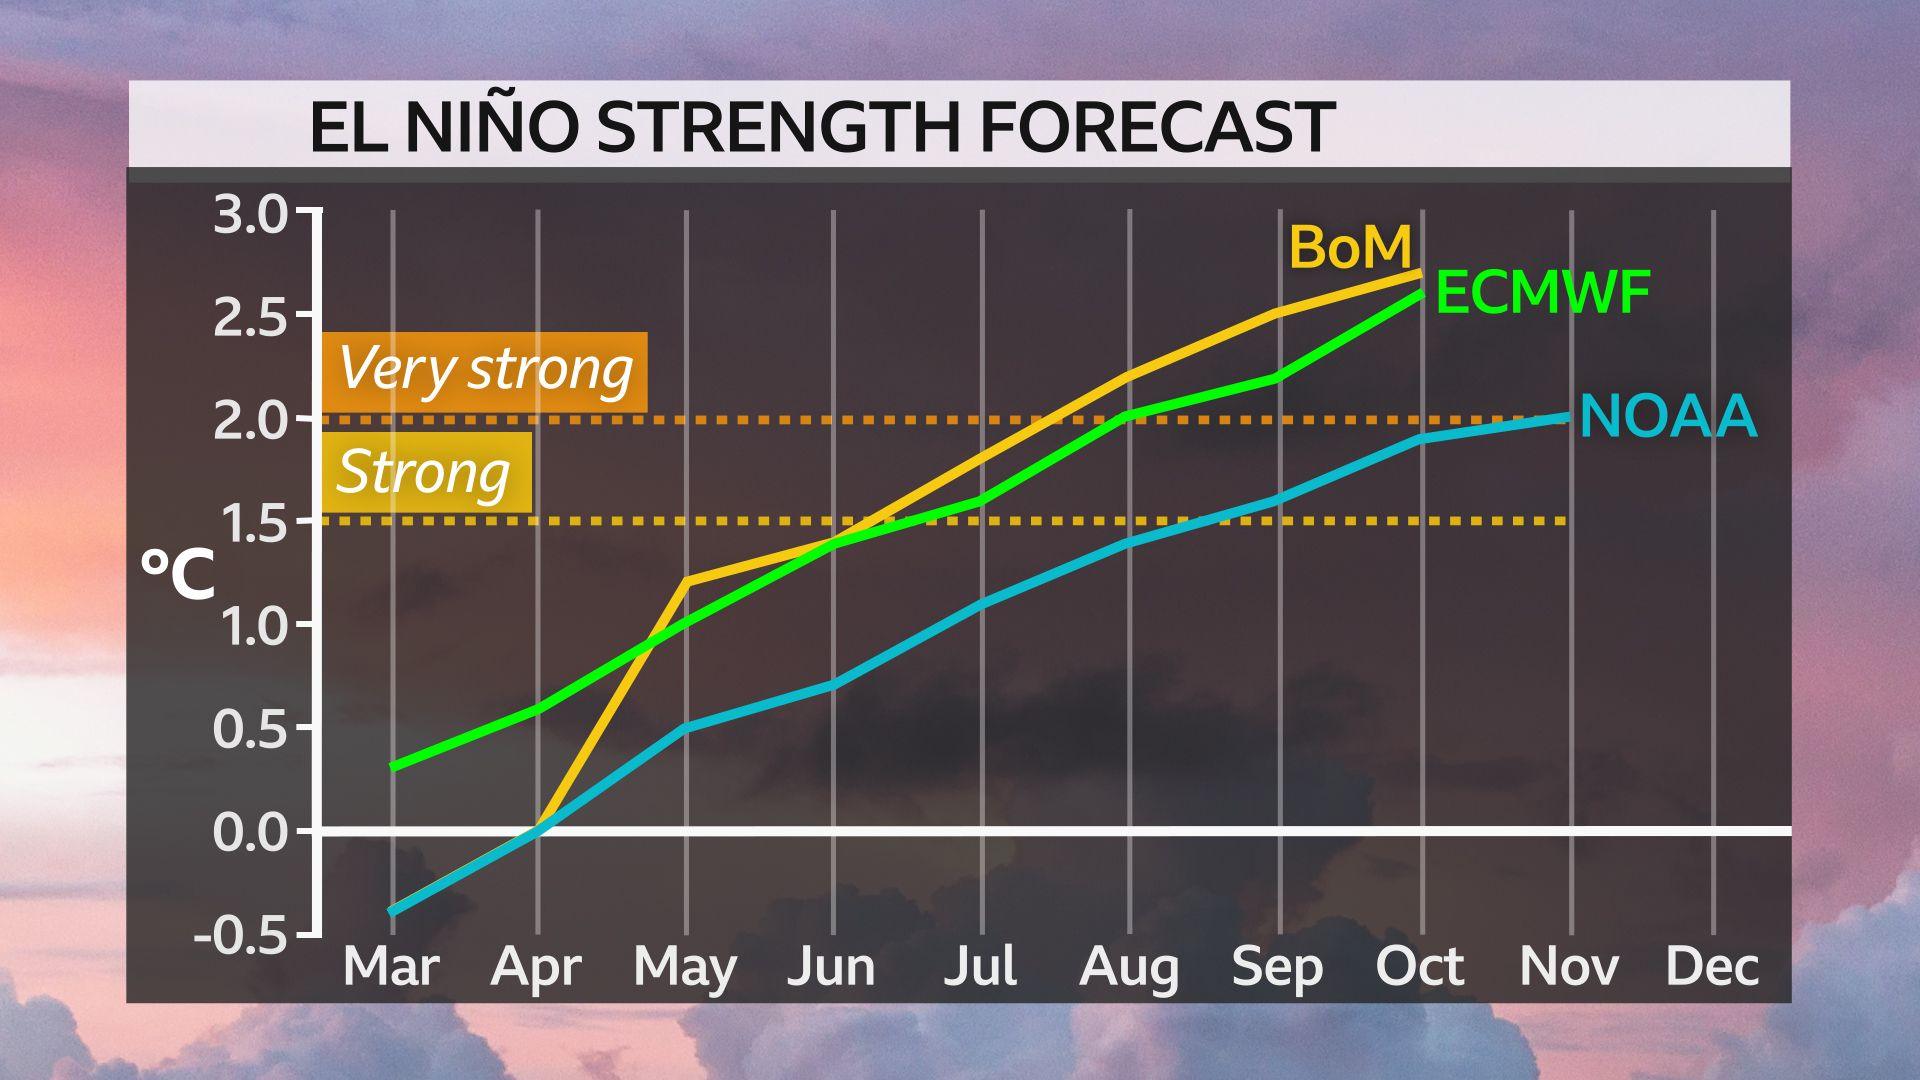
What is a strong El Niño?
While El Niño forms across the tropical Pacific, forecasters look at one region in particular called the Niño3.4, monitoring a three-monthly average of the sea surface temperature compared to the long-term average.
A strong or ‘super El Nińo’ is when that goes above 1.5C.
Forecasts from the European Centre for Medium Range Weather Forecasts (ECMWF), NOAA and BoM are all pretty much aligned in their outcomes.
In the latest prediction from the ECMWF, more than half of their forecast models suggest a temperature increase of over 2.5C by the autumn.
Anything over this would be a “historically strong event,” said Johnson.
BoM forecasts are also confidently showing the possibility of a very strong El Niño to develop later this year.
Some forecast data is even suggesting the temperature rise could exceed 3C, surpassing the current known peak of 2.7C recorded in 1877.
It should be noted this was a very different era with limited observations and so there remains a lot of uncertainty in the reported temperature.
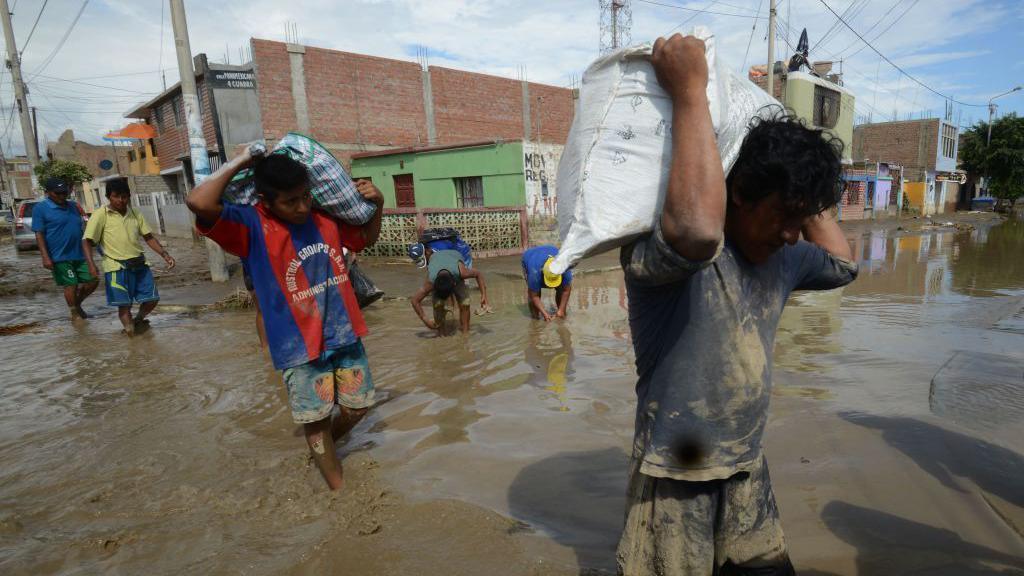
That El Niño lasted around 18 months which triggered a catastrophic global climate event, causing extreme drought and widespread famine across Asia, Brazil, and Africa which killed millions, while producing severe flooding in other regions like Peru.
The last ‘very strong’ El Niño occured in 2015-2016 when the average three-monthly (November, December, January) Niño3.4 temperature increase reached 2.4C.
What are the consequences of a strong El Niño?
With the extra heat in the eastern Pacific, the biggest impact of El Niño is boosting global average temperature, typically by 0.2C.
Liz Stephens, professor of climate risk and resilience at the University of Reading told the BBC that we’re “probably be looking at record global temperatures next year, especially if this is a very strong El Nino event”.
Following the 2023/24 El Niño we saw the hottest year on record.
While you might see more direct weather impacts around the Pacific, every El Niño is unique in terms of its strength and how far reaching its disruption is to global weather patterns.
Flooding in northern Peru and southern Ecuador is common but also potentially in East Africa, Central Asia and southern portions of North America.
It also suppresses Atlantic tropical storms. Forecasters are already suggesting this years Atlantic hurricane season is going to be quieter than average.
“While that sounds like a good thing, for Central America that leads to a lot less rainfall and potentially drought conditions,” according to Prof Stephens.
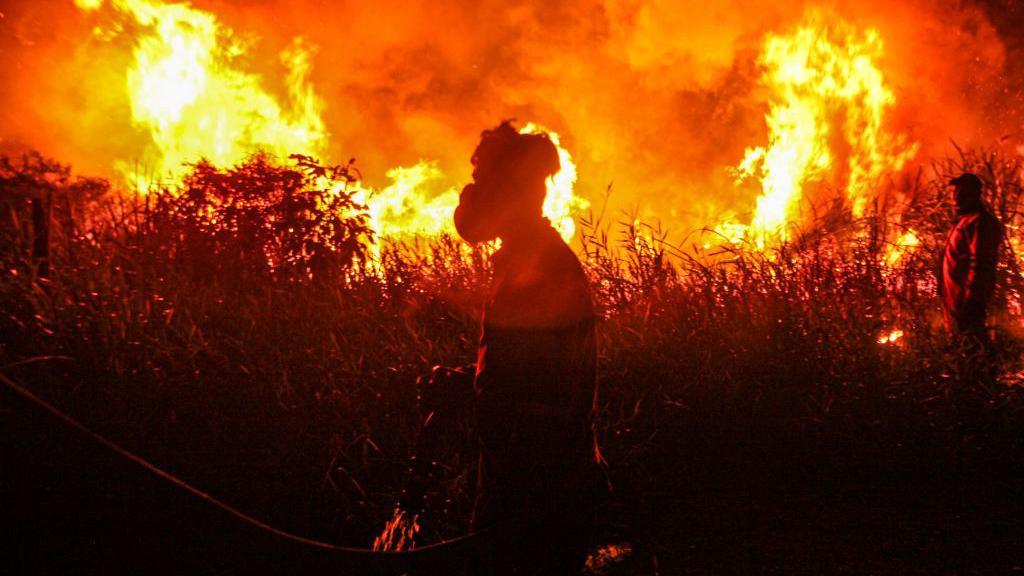
There is also a greater chance of drought and wildfires in parts of Australia, Indonesia and the north of South America, leading to a decline in agriculture and global food stocks.
‘Huge humanitarian impacts to come’
The closure of the Strait of Hormuz is already disrupting the distribution of fertiliser with its price increased. This will impact harvests in the months to come with a reduced food supply and higher prices.
“You’ve got more people that are living in poverty already and if you get a reduction in crop yields because of drought or flooding [from El Niño] then that drives prices even higher.
“So we’re looking at potentially quite huge humanitarian impacts this year, especially if the crisis in the Middle East continues,” said Prof Stephens.
Whilst the direct impacts on the UK weather are less certain, climate scientists at the Met Office suggest that El Niño years are one factor that can increase the risk of colder winters in the UK. An El Niño event is expected to develop from mid-2026, impacting global temperature and rainfall patterns, according to the World Meteorological Organization (WMO). The latest monthly Global Seasonal Climate Update from WMO signals a clear shift in the Equatorial Pacific: sea-surface temperatures are rising rapidly, pointing to a likely return of El Niño conditions as early as May–July 2026. Forecasts indicate there is a “nearly global dominance of above-normal land surface temperatures” in the upcoming three-month period, and regional variations in rainfall patterns.
“After a period of neutral conditions at the start of the year, climate models are now strongly aligned, and there is high confidence in the onset of El Niño, followed by further intensification in the months that follow,” said Wilfran Moufouma Okia, Chief of Climate Prediction at WMO.
“Models indicate that this may be a strong event – but the so-called spring predictability barrier is a challenge for the certainty of forecasts at this time of year. Forecast confidence generally improves after April,” he says.
El Niño and La Niña are opposite phases of the El Niño–Southern Oscillation (ENSO); one of the most powerful climate patterns on Earth. These events reshape global weather, influencing rainfall, drought, and extreme events across regions. Governments, humanitarian organizations, water managers, and farmers depend on accurate and timely ENSO forecasts to anticipate and respond to risks.
El Niño is characterized by a warming of ocean surface temperatures in the central and eastern Equatorial Pacific. It typically occurs every two to seven years and lasts around nine to twelve months.
WMO does not use the term “super El Niño” because it is not part of standardized operational classifications.
Typical impacts
El Niño events affect temperature and rainfall patterns in different regions and typically have a warming effect on the global climate. Thus, 2024 was the hottest year on record because of the combination of the powerful 2023-2024 El Niño and human-induced climate change from greenhouse gases.
There is no evidence that climate change increases the frequency or intensity of El Nino events. But it can amplify associated impacts because a warmer ocean and atmosphere increases the availability of energy and moisture for extreme weather events such as heatwaves and heavy rainfall.
Each El Niño event is unique in terms of its evolution, spatial pattern and impacts.
However, it is typically associated with increased rainfall in parts of southern South America, the southern United States, the Horn of Africa and central Asia, and drought over Australia, Indonesia, and parts of southern Asia.
During the Boreal summer, El Niño’s warm water can fuel hurricanes in the central/eastern Pacific Ocean, while it hinders hurricane formation in the Atlantic Basin.
Global seasonal climate update
WMO also issues a monthly Global Seasonal Climate Update which takes into account ENSO and other key climate drivers, such as the North Atlantic Oscillation, the Southern Annular Mode or the Indian Ocean Dipole.
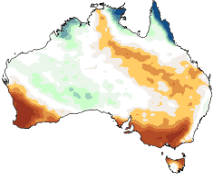
For the May-June-July season, land surface temperatures are expected to be above-normal nearly everywhere. The signal is especially strong over southern North America, Central America, and the Caribbean, as well as Europe and Northern Africa.
Rainfall predictions show strong regional variations.

Probabilistic forecasts of surface air temperature and precipitation for the season May-July 2026.
Preparedness and early action
Seasonal forecasts are vital to guide preparedness actions, especially in climate-sensitive sectors like agriculture, water resource management, energy and health.
El Niño/La Niña Updates
The El Niño/La Niña Update provides analysis of the current conditions and evolution of the status of the El Niño-Southern Oscillation phenomenon. These include detailed information on sea surface and subsurface temperature anomalies, atmospheric circulation, cloudiness and rainfall patterns. The Update is prepared through a collaborative effort between WMO and the International Research Institute for Climate and Society, with contributions from experts worldwide. The El Niño/La Niña Update is crucial for governments, humanitarian and disaster risk agencies, and policymakers to prepare for climate-related impacts and to provide guidance for meteorologists worldwide to refine regional predictions.

This is based on contributions from WMO Global Producing Centres for Seasonal Prediction and expert consensus, facilitated by WMO and the International Research Institute for Climate and Society.
Regional climate outlook forums issue seasonal predictions at a regional level – for instance the South Asian Climate Outlook Forum will issue its forecast for the South Asian southwest monsoon on 28 April. National Meteorological and Hydrological Services are responsible for national updates.
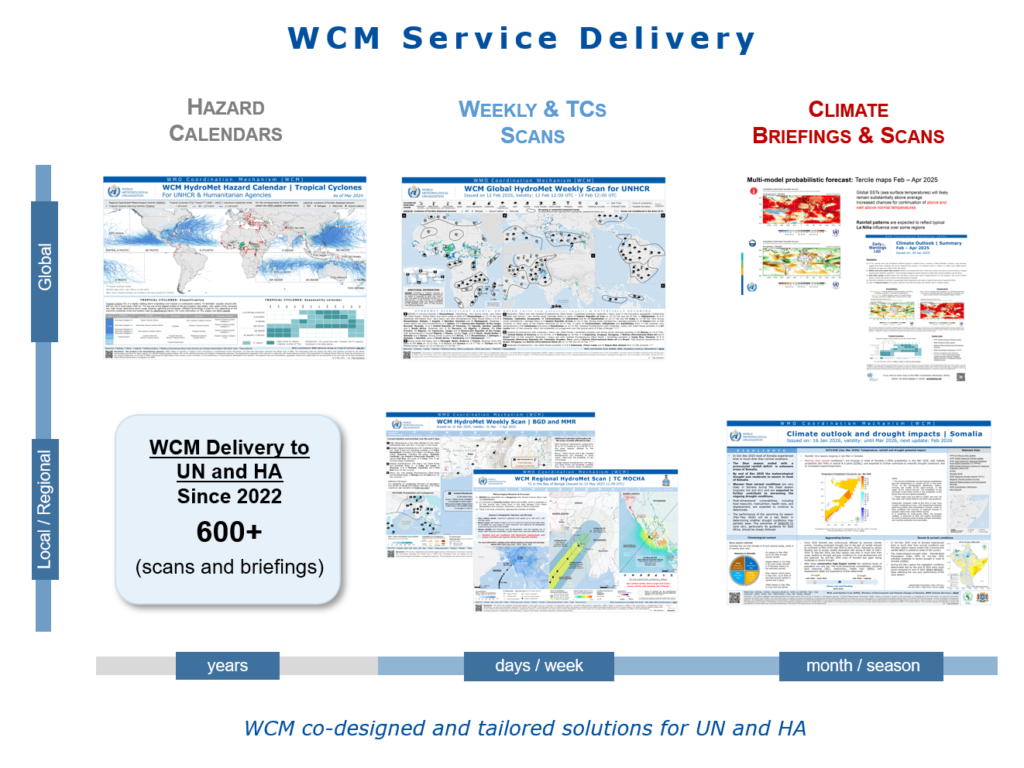
WMO Coordination Mechanism (WCM) to support humanitarian activities

Co-designed and tailored solutions for United Nations (UN) and Humanitarian Agencies (HA)
The WMO Coordination Mechanism (WCM), a core element of the Early Warnings for All (EW4All) initiative, supports crisis-prone and conflict-affected regions with expert advice and situational awareness.
WCM delivers co-designed and tailored solutions to United Nations (UN) and Humanitarian Agencies (HA), curating authoritative weather, climate and water information and expert advice from WMO Members and Centres, advancing early action, enhancing preparedness efforts, and providing crisis support. It also plays an important role in terms of capacity building.
Since 2022, thanks to the contributions from WMO Members and Centres, UN / HA and Partner Organisations, over 600 WCM products (scans and briefings) have supported humanitarian agencies in saving lives and livelihoods (e.g. WCM HydroMet Scans for the Extremely Severe Cyclonic Storm MOCHA in Myanmar / Bangladesh in 2023, earthquake-impacted areas in Myanmar in 2025, on-going drought in Somalia).
WCM Core Activities:
- Facilitate access to authoritative weather, climate and water information, and expert advice from WMO Members / Centres to UN / HA
- Advance humanitarian Early Action and Crisis Support, through co-designed and tailored solutions (WCM Service Delivery)
- Contribute to UN and HA activities (e.g. EW4All initiative, Inter-Agency Standing Committee-IASC groups, AI pilot projects)
- Provide capacity building for WMO Members / Centres and UN / HA
- Increase the visibility of WMO Members / Centres within UN / HA community
WCM Global Seasonal Climate Outlook

WCM Global Seasonal Climate Outlook Briefing for UN and Humanitarian Agencies
- Service Delivery: Regularised
- Distribution: Public
- Co-designed with: Save the Children and Start Network
WCM provides global and regional seasonal climate outlook briefings and scans to meet the growing demand from UN and humanitarian agencies (HA) for authoritative information and insights on modes of climate variability (such as El Niño–Southern Oscillation), seasonal forecasts and reasons for concern at seasonal time scale. Drawing on the expertise and data of WMO Members and Centres, this support helps the UN and HA strengthen early action, contingency planning, risk analysis, and strategic preparedness.
- Seasonal climate outlook briefings: Monthly global seasonal climate outlooks, and quarterly regional and sub-regional climate outlooks for UN an HA.
- Seasonal climate outlook scans: Responses to ad-hoc requests.
In 2025, WCM launched regular monthly global seasonal climate outlook briefings for the wider UN and HA community. The briefing content builds on information and expertise from WMO Members and Centres, as well as collaboration with UN and HA partners, and follows the successful climate outlook sessions initiated in 2024 with Save the Children and the Start Network.
These virtual sessions are held in English and last approximately 40 minutes, including presentations and Q&A. Each session typically includes:
- Global seasonal climate outlook for next three months by WCM Team,
- Regional seasonal climate outlook for a focus region/subregion or specific hazard outlook (e.g. tropical cyclone outlook for an oceanic basin), delivered by a RCC, RSMC or NMHS,
- An example of local humanitarian action supported on HydroMet and climate information, presented by a UN or HA partner,
- Q&A with climate and humanitarian experts.
In addition to the briefing, participants receive session materials (slides, recording, and Q&A transcription) and a one-page summary.
Long-range forecast overview
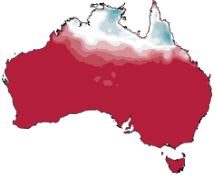
The long-range forecast for July to September shows:
- Rainfall is likely to be below average across parts of southern and eastern Australia.
- Daytime temperatures are likely to be above average south of the tropics.
- Overnight temperatures are likely to be above average for much of Australia.
The Southern Hemisphere Monitoring page contains information on the broader hemispheric climate state, including the current status of the El Niño–Southern Oscillation and the Indian Ocean Dipole. This information is useful because:
- it can be a source of longer-term predictability, which can provide intelligence that extends beyond the long-range forecast period.
- understanding the long-range forecast is improved through the assessment of its consistency within the broader climate system.
Tropical Pacific edges closer to El Niño
- The tropical Pacific is approaching El Niño conditions. Sea surface temperatures (SSTs) in the central tropical Pacific now exceed El Niño thresholds, while atmospheric indicators are also starting to align with an El Niño state. This suggests some coupling between the ocean and atmosphere may be occurring. Should this be sustained, an El Niño event is likely to become established.
- The latest relative Niño3.4 index value for the week ending 7 June 2026 is +0.81 °C, just above the El Niño threshold (+0.80 °C). All models, including the Bureau’s, forecast the tropical Pacific to continue warming in the coming months.
- Atmospheric indicators, such as trade winds, pressure and cloud patterns are trending towards an El Niño state.
- As of 7 June 2026, the 30-day Southern Oscillation Index (SOI) is −21.7. The 60-day and 90-day SOI index values are −14.9 and −9.5, respectively. Trade winds are weaker than average across the tropical Pacific, however, there has yet to be a sustained shift in cloud patterns near the Date Line. Combined, these indicators suggest the atmosphere is beginning to respond to the SST signal in the tropical Pacific and is showing early stages of ocean-atmosphere coupling that is required for an established event.
- Some uncertainty remains in the likely strength of this El Niño event. Models indicate it will be at least moderate in strength, with the possibility of a strong event, based on the extent of warming in the central tropical Pacific.
- A strong El Niño signal in the Nino3.4 region does not necessarily mean strong impacts on Australia’s climate; ENSO is only one of many factors that can influence Australia’s seasonal weather and climate.
- The Indian Ocean Dipole (IOD) is currently neutral. As of 7 June 2026, the IOD index is −0.34 °C. Forecasts remain uncertain but most models indicate neutral conditions to persist until at least mid-winter, with the development of a positive IOD event possible during winter–spring. Model forecasts show a large variation in both timing and strength of this potential event.
- The SST analysis for the week ending 7 June 2026 shows waters are average to above average around most of Australia. Waters are especially warm along the New South Wales and eastern Tasmania coasts (peaking at around 3 to 4 °C above average). This SST pattern is forecast to continue in the coming months.
- The Southern Annular Mode (SAM) index is positive as of 6 June 2026. It is forecast to return to neutral during mid-to-late June.
El Niño conditions are present and expected to strengthen into the Northern Hemisphere winter 2026-27.
El Niño conditions developed over the past month, as shown by above-average sea surface temperatures (SSTs) across the central to eastern equatorial Pacific Ocean . The latest weekly Niño-3.4 index value was +0.7°C, with the westernmost (Niño-4) and easternmost (Niño-1+2) indices at +0.7°C and +2.1°C, respectively. The equatorial subsurface temperature index (average from 180°-100°W) decreased in the past month, but significantly above-average subsurface temperatures remained in the central and eastern equatorial Pacific. Low-level westerly wind anomalies and upper-level easterly wind anomalies were evident over the central equatorial Pacific. Convection was slightly above average over the central and east-central equatorial Pacific and was near or below average over Indonesia [Fig. 5]. The traditional and equatorial Southern Oscillation indices were negative. Collectively, the coupled ocean-atmosphere system reflected the onset of El Niño conditions.
![[Fig. 5]](https://www.cpc.ncep.noaa.gov/products/analysis_monitoring/enso_advisory/figure05.gif)
The North American Multi-Model Ensemble (NMME) average, including the NCEP CFSv2 forecasts El Niño to intensify into the Northern Hemisphere winter 2026-27. High confidence in El Niño is also linked to anomalously high oceanic heat content and expanding westerly wind anomalies across the equatorial Pacific Ocean.
Official NOAA CPC ENSO Strength Probabilities
Issued June 2026
The bars show the chance of El Niño (red bars), ENSO-Neutral (grey bars), and La Niña (blue bars) provided for 9 upcoming, overlapping 3-month seasons (each letter represents a month, for example, F = February). Alternatively, the table presents the percent chances of each strength category in numerical form.
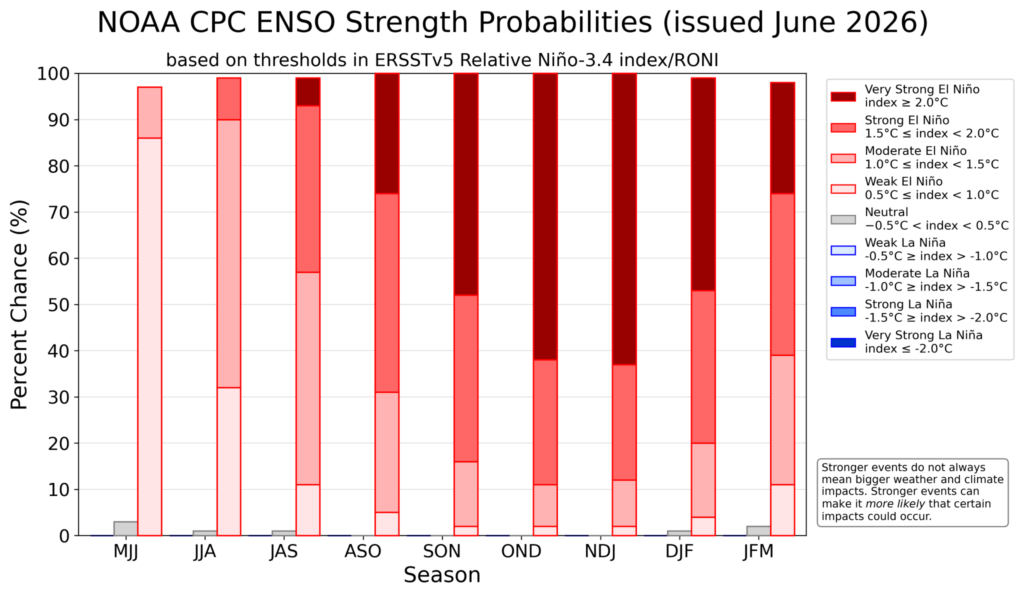
| Season | Index ≤ -2.0°C | -1.5°C ≥ Index > -2.0°C | -1.0°C ≥ Index > -1.5°C | -0.5°C ≥ Index > -1.0°C | −0.5°C < Index < 0.5°C | 0.5°C ≤ Index < 1.0°C | 1.0°C ≤ Index < 1.5°C | 1.5°C ≤ Index < 2.0°C | Index ≥ 2.0°C |
|---|---|---|---|---|---|---|---|---|---|
| MJJ | 0 | 0 | 0 | 0 | 3 | 86 | 11 | 0 | 0 |
| JJA | 0 | 0 | 0 | 0 | 1 | 32 | 58 | 9 | 0 |
| JAS | 0 | 0 | 0 | 0 | 1 | 11 | 46 | 36 | 6 |
| ASO | 0 | 0 | 0 | 0 | 0 | 5 | 26 | 43 | 26 |
| SON | 0 | 0 | 0 | 0 | 0 | 2 | 14 | 36 | 48 |
| OND | 0 | 0 | 0 | 0 | 0 | 2 | 9 | 27 | 62 |
| NDJ | 0 | 0 | 0 | 0 | 0 | 2 | 10 | 25 | 63 |
| DJF | 0 | 0 | 0 | 0 | 1 | 4 | 16 | 33 | 46 |
| JFM | 0 | 0 | 0 | 0 | 2 | 11 | 28 | 35 | 24 |
Warm (red) and cold (blue) periods based on a threshold of +/- 0.5°C for the Relative Oceanic Niño Index (RONI), using the 1991–2020 base period [3 month running mean of ERSST.v5 SST anomalies in the Niño 3.4 region (5°N–5°S, 120°–170°W) with average tropical mean (20°N–20°S) SST anomalies subtracted. The difference is then adjusted so the variance equals the original Niño 3.4 index].
For historical purposes, periods of below and above normal SSTs are colored in blue and red when the threshold is met for a minimum of five (5) consecutive overlapping seasons. The RONI is one measure of the El Niño Southern Oscillation, and other indices can confirm whether features consistent with a coupled ocean-atmosphere phenomenon accompanied these periods.
| Year | DJF | JFM | FMA | MAM | AMJ | MJJ | JJA | JAS | ASO | SON | OND | NDJ |
|---|---|---|---|---|---|---|---|---|---|---|---|---|
| 1950 | -1.5 | -1.3 | -1.1 | -1.1 | -1.0 | -0.7 | -0.4 | -0.2 | -0.2 | -0.3 | -0.4 | -0.6 |
| 1951 | -0.5 | -0.2 | 0.3 | 0.6 | 0.6 | 0.7 | 0.7 | 0.8 | 0.9 | 1.0 | 0.9 | 0.8 |
| 1952 | 0.6 | 0.4 | 0.4 | 0.4 | 0.3 | 0.1 | 0.0 | 0.0 | 0.1 | 0.0 | 0.0 | 0.2 |
| 1953 | 0.5 | 0.8 | 0.8 | 0.8 | 0.8 | 0.8 | 0.7 | 0.7 | 0.7 | 0.8 | 0.8 | 0.9 |
| 1954 | 1.0 | 0.7 | 0.1 | -0.2 | -0.3 | -0.3 | -0.5 | -0.7 | -0.8 | -0.7 | -0.6 | -0.4 |
| 1955 | -0.4 | -0.3 | -0.3 | -0.4 | -0.4 | -0.4 | -0.4 | -0.6 | -1.0 | -1.4 | -1.6 | -1.3 |
| 1956 | -0.7 | -0.3 | -0.2 | -0.1 | 0.0 | -0.1 | -0.3 | -0.3 | -0.3 | -0.3 | -0.4 | -0.2 |
| 1957 | 0.0 | 0.4 | 0.7 | 1.0 | 1.1 | 1.2 | 1.2 | 1.3 | 1.2 | 1.3 | 1.5 | 1.9 |
| 1958 | 2.0 | 1.9 | 1.4 | 1.1 | 0.8 | 0.7 | 0.5 | 0.3 | 0.2 | 0.3 | 0.4 | 0.7 |
| 1959 | 0.8 | 0.8 | 0.7 | 0.4 | 0.3 | -0.1 | -0.2 | -0.4 | -0.3 | -0.3 | -0.1 | 0.0 |
| Year | DJF | JFM | FMA | MAM | AMJ | MJJ | JJA | JAS | ASO | SON | OND | NDJ |
| 1960 | 0.0 | 0.0 | 0.0 | 0.1 | 0.1 | 0.0 | 0.1 | 0.2 | 0.2 | 0.1 | 0.0 | 0.0 |
| 1961 | 0.1 | 0.1 | 0.0 | 0.1 | 0.3 | 0.3 | 0.2 | -0.1 | -0.3 | -0.3 | -0.2 | -0.1 |
| 1962 | -0.1 | -0.1 | -0.1 | -0.2 | -0.3 | -0.2 | -0.1 | -0.2 | -0.2 | -0.4 | -0.5 | -0.5 |
| 1963 | -0.4 | -0.1 | 0.2 | 0.2 | 0.2 | 0.4 | 0.7 | 1.0 | 1.0 | 1.1 | 1.2 | 1.3 |
| 1964 | 1.1 | 0.7 | 0.1 | -0.4 | -0.6 | -0.6 | -0.6 | -0.6 | -0.7 | -0.8 | -0.7 | -0.5 |
| 1965 | -0.2 | 0.1 | 0.2 | 0.4 | 0.6 | 1.0 | 1.4 | 1.7 | 1.9 | 2.0 | 2.0 | 1.9 |
| 1966 | 1.7 | 1.5 | 1.3 | 0.9 | 0.5 | 0.3 | 0.3 | 0.1 | 0.0 | -0.1 | -0.1 | -0.2 |
| 1967 | -0.2 | -0.2 | -0.4 | -0.4 | -0.2 | 0.2 | 0.3 | 0.1 | 0.0 | -0.1 | 0.0 | 0.0 |
| 1968 | -0.2 | -0.3 | -0.3 | -0.2 | 0.2 | 0.5 | 0.7 | 0.6 | 0.5 | 0.6 | 0.8 | 1.1 |
| 1969 | 1.2 | 1.1 | 0.9 | 0.5 | 0.4 | 0.2 | 0.2 | 0.4 | 0.7 | 0.8 | 0.7 | 0.6 |
| Year | DJF | JFM | FMA | MAM | AMJ | MJJ | JJA | JAS | ASO | SON | OND | NDJ |
| 1970 | 0.5 | 0.3 | 0.3 | 0.1 | 0.0 | -0.3 | -0.6 | -0.7 | -0.7 | -0.6 | -0.7 | -0.9 |
| 1971 | -1.0 | -1.0 | -0.8 | -0.6 | -0.5 | -0.4 | -0.4 | -0.4 | -0.5 | -0.5 | -0.5 | -0.5 |
| 1972 | -0.3 | 0.0 | 0.4 | 0.8 | 0.9 | 1.1 | 1.3 | 1.5 | 1.7 | 2.0 | 2.2 | 2.3 |
| 1973 | 2.0 | 1.4 | 0.6 | -0.2 | -0.8 | -1.1 | -1.2 | -1.4 | -1.5 | -1.8 | -1.9 | -1.9 |
| 1974 | -1.5 | -1.2 | -0.9 | -0.9 | -0.8 | -0.6 | -0.4 | -0.2 | -0.2 | -0.4 | -0.4 | -0.2 |
| 1975 | -0.1 | -0.1 | -0.3 | -0.5 | -0.6 | -0.8 | -0.9 | -0.9 | -1.0 | -1.0 | -1.1 | -1.1 |
| 1976 | -1.0 | -0.6 | -0.3 | -0.1 | 0.0 | 0.2 | 0.5 | 0.7 | 0.9 | 1.1 | 1.1 | 1.1 |
| 1977 | 1.0 | 0.9 | 0.5 | 0.3 | 0.2 | 0.4 | 0.4 | 0.6 | 0.8 | 1.0 | 1.1 | 1.1 |
| 1978 | 0.9 | 0.6 | 0.1 | -0.2 | -0.4 | -0.3 | -0.3 | -0.3 | -0.2 | 0.0 | 0.2 | 0.2 |
| 1979 | 0.2 | 0.2 | 0.2 | 0.2 | 0.1 | -0.1 | 0.0 | 0.2 | 0.4 | 0.5 | 0.5 | 0.7 |
| Year | DJF | JFM | FMA | MAM | AMJ | MJJ | JJA | JAS | ASO | SON | OND | NDJ |
| 1980 | 0.6 | 0.5 | 0.3 | 0.2 | 0.3 | 0.3 | 0.2 | 0.0 | 0.0 | 0.1 | 0.2 | 0.2 |
| 1981 | 0.0 | -0.3 | -0.3 | -0.3 | -0.3 | -0.3 | -0.3 | -0.2 | -0.1 | -0.2 | -0.2 | 0.0 |
| 1982 | 0.1 | 0.3 | 0.4 | 0.6 | 0.8 | 0.8 | 0.9 | 1.3 | 1.8 | 2.2 | 2.4 | 2.5 |
| 1983 | 2.5 | 2.2 | 1.7 | 1.4 | 1.0 | 0.6 | 0.1 | -0.2 | -0.6 | -0.9 | -1.1 | -1.0 |
| 1984 | -0.5 | -0.3 | -0.3 | -0.5 | -0.6 | -0.4 | -0.2 | -0.1 | -0.1 | -0.5 | -0.8 | -1.0 |
| 1985 | -0.8 | -0.6 | -0.6 | -0.7 | -0.7 | -0.5 | -0.4 | -0.3 | -0.2 | -0.2 | -0.1 | -0.2 |
| 1986 | -0.3 | -0.3 | -0.2 | -0.1 | -0.1 | -0.1 | 0.3 | 0.6 | 0.9 | 1.2 | 1.4 | 1.5 |
| 1987 | 1.6 | 1.5 | 1.3 | 1.0 | 0.9 | 1.1 | 1.3 | 1.6 | 1.5 | 1.3 | 1.0 | 0.9 |
| 1988 | 0.7 | 0.3 | -0.2 | -0.7 | -1.4 | -1.7 | -1.6 | -1.3 | -1.4 | -1.6 | -1.9 | -1.9 |
| 1989 | -1.7 | -1.4 | -1.1 | -0.8 | -0.6 | -0.4 | -0.3 | -0.3 | -0.2 | -0.2 | -0.1 | 0.0 |
| Year | DJF | JFM | FMA | MAM | AMJ | MJJ | JJA | JAS | ASO | SON | OND | NDJ |
| 1990 | 0.2 | 0.3 | 0.3 | 0.3 | 0.2 | 0.2 | 0.3 | 0.4 | 0.4 | 0.4 | 0.4 | 0.5 |
| 1991 | 0.6 | 0.5 | 0.4 | 0.4 | 0.5 | 0.7 | 0.8 | 0.8 | 0.9 | 1.2 | 1.7 | 2.1 |
| 1992 | 2.3 | 2.2 | 2.0 | 1.7 | 1.4 | 0.9 | 0.5 | 0.3 | 0.2 | 0.1 | 0.1 | 0.3 |
| 1993 | 0.5 | 0.7 | 0.9 | 1.0 | 0.9 | 0.7 | 0.5 | 0.5 | 0.5 | 0.4 | 0.3 | 0.3 |
| 1994 | 0.3 | 0.3 | 0.4 | 0.5 | 0.6 | 0.6 | 0.7 | 0.8 | 1.0 | 1.1 | 1.3 | 1.4 |
| 1995 | 1.3 | 1.0 | 0.7 | 0.4 | 0.1 | -0.1 | -0.3 | -0.5 | -0.7 | -0.9 | -0.9 | -0.9 |
| 1996 | -0.9 | -0.8 | -0.6 | -0.4 | -0.3 | -0.3 | -0.2 | -0.2 | -0.2 | -0.3 | -0.3 | -0.3 |
| 1997 | -0.2 | -0.1 | 0.2 | 0.5 | 1.0 | 1.3 | 1.7 | 2.0 | 2.3 | 2.4 | 2.4 | 2.3 |
| 1998 | 2.2 | 1.8 | 1.3 | 0.8 | 0.1 | -0.5 | -1.2 | -1.4 | -1.5 | -1.5 | -1.6 | -1.6 |
| 1999 | -1.5 | -1.3 | -1.1 | -1.0 | -1.0 | -1.0 | -1.0 | -1.0 | -1.0 | -1.1 | -1.4 | -1.6 |
| Year | DJF | JFM | FMA | MAM | AMJ | MJJ | JJA | JAS | ASO | SON | OND | NDJ |
| 2000 | -1.7 | -1.4 | -1.1 | -0.8 | -0.6 | -0.5 | -0.4 | -0.4 | -0.4 | -0.6 | -0.7 | -0.7 |
| 2001 | -0.6 | -0.5 | -0.5 | -0.5 | -0.3 | -0.1 | 0.0 | 0.0 | 0.0 | -0.2 | -0.2 | -0.3 |
| 2002 | -0.1 | 0.0 | 0.0 | 0.1 | 0.4 | 0.7 | 0.9 | 1.1 | 1.3 | 1.4 | 1.5 | 1.2 |
| 2003 | 0.9 | 0.5 | 0.2 | -0.2 | -0.4 | -0.3 | 0.0 | 0.2 | 0.2 | 0.2 | 0.3 | 0.3 |
| 2004 | 0.3 | 0.1 | 0.1 | 0.2 | 0.3 | 0.5 | 0.7 | 0.8 | 0.9 | 0.8 | 0.7 | 0.7 |
| 2005 | 0.6 | 0.4 | 0.3 | 0.3 | 0.2 | 0.0 | -0.1 | -0.1 | 0.0 | -0.2 | -0.5 | -0.8 |
| 2006 | -0.9 | -0.9 | -0.6 | -0.4 | -0.1 | 0.0 | 0.1 | 0.3 | 0.5 | 0.8 | 0.9 | 0.9 |
| 2007 | 0.6 | 0.2 | -0.2 | -0.4 | -0.4 | -0.5 | -0.6 | -0.8 | -1.0 | -1.3 | -1.4 | -1.5 |
| 2008 | -1.6 | -1.5 | -1.3 | -0.9 | -0.8 | -0.5 | -0.3 | -0.2 | -0.3 | -0.4 | -0.6 | -0.8 |
| 2009 | -0.9 | -0.8 | -0.7 | -0.4 | -0.1 | 0.1 | 0.3 | 0.4 | 0.6 | 0.9 | 1.3 | 1.6 |
| Year | DJF | JFM | FMA | MAM | AMJ | MJJ | JJA | JAS | ASO | SON | OND | NDJ |
| 2010 | 1.5 | 1.1 | 0.6 | 0.1 | -0.5 | -1.0 | -1.3 | -1.5 | -1.7 | -1.7 | -1.7 | -1.6 |
| 2011 | -1.4 | -1.2 | -0.9 | -0.7 | -0.5 | -0.3 | -0.4 | -0.5 | -0.7 | -0.9 | -1.0 | -1.0 |
| 2012 | -0.8 | -0.6 | -0.6 | -0.5 | -0.3 | 0.0 | 0.3 | 0.4 | 0.4 | 0.2 | -0.1 | -0.4 |
| 2013 | -0.6 | -0.6 | -0.5 | -0.4 | -0.4 | -0.4 | -0.4 | -0.3 | -0.3 | -0.2 | -0.2 | -0.3 |
| 2014 | -0.5 | -0.5 | -0.3 | 0.0 | 0.1 | 0.0 | -0.1 | -0.1 | 0.1 | 0.4 | 0.5 | 0.6 |
| 2015 | 0.5 | 0.4 | 0.5 | 0.6 | 0.8 | 1.0 | 1.3 | 1.6 | 1.9 | 2.2 | 2.3 | 2.4 |
| 2016 | 2.2 | 1.8 | 1.3 | 0.5 | -0.1 | -0.6 | -0.9 | -1.0 | -1.1 | -1.1 | -1.1 | -1.0 |
| 2017 | -0.7 | -0.5 | -0.3 | -0.1 | 0.1 | 0.1 | -0.2 | -0.5 | -0.7 | -1.0 | -1.1 | -1.3 |
| 2018 | -1.1 | -1.0 | -0.9 | -0.7 | -0.3 | 0.0 | 0.1 | 0.2 | 0.4 | 0.7 | 0.8 | 0.7 |
| 2019 | 0.6 | 0.6 | 0.6 | 0.5 | 0.3 | 0.2 | 0.0 | -0.1 | 0.0 | 0.1 | 0.2 | 0.2 |
| Year | DJF | JFM | FMA | MAM | AMJ | MJJ | JJA | JAS | ASO | SON | OND | NDJ |
| 2020 | 0.1 | 0.1 | 0.0 | -0.3 | -0.6 | -0.8 | -0.8 | -0.9 | -1.2 | -1.5 | -1.5 | -1.4 |
| 2021 | -1.2 | -1.0 | -1.0 | -0.8 | -0.6 | -0.5 | -0.6 | -0.7 | -0.9 | -1.1 | -1.2 | -1.2 |
| 2022 | -1.2 | -1.2 | -1.3 | -1.3 | -1.2 | -1.0 | -0.9 | -1.0 | -1.1 | -1.1 | -1.0 | -1.0 |
| 2023 | -0.8 | -0.6 | -0.4 | -0.2 | 0.1 | 0.4 | 0.6 | 0.9 | 1.1 | 1.4 | 1.5 | 1.5 |
| 2024 | 1.2 | 0.9 | 0.5 | 0.1 | -0.3 | -0.5 | -0.5 | -0.6 | -0.8 | -0.8 | -0.9 | -1.1 |
| 2025 | -1.1 | -0.9 | -0.7 | -0.5 | -0.5 | -0.4 | -0.5 | -0.6 | -0.8 | -0.9 | -0.9 | -1.0 |
| 2026 | -0.9 | -0.7 | -0.4 | -0.1 |
Even very strong El Niño events do not lead to the expected impact everywhere, but stronger events can more significantly tilt the odds in favor of expected outcomes. In summary, El Niño conditions are present and expected to strengthen into the Northern Hemisphere winter 2026-27.
This discussion is a consolidated effort of the National Oceanic and Atmospheric Administration (NOAA), NOAA’s National Weather Service, and their funded institutions. Observations indicate near-average sea surface temperatures (SSTs) in the central and eastern equatorial Pacific, alongside increasing subsurface heat content.
Most dynamical and statistical forecast models suggest that ENSO-neutral conditions will persist through boreal spring and El Niño conditions to emerge during boreal summer/autumn, with some suggesting. The Indian Shield (Positive IOD): Often called the “Indian El Niño,” a positive IOD occurs when the western Indian Ocean (near Africa) becomes warmer than the eastern part (near Indonesia). This temperature difference reverses local wind patterns, pulling heavy moisture directly toward the Indian landmass.
Can the IOD Defeat a ‘Super El Niño’?
Historically, the Indian Ocean Dipole cannot outright “stop” the Pacific system, but it can dramatically alter the outcome:
+------------------------------------------+------------------------------------------+

| Pacific El Niño Impact (Without IOD)     | Pacific El Niño + Positive IOD Clash     |
+------------------------------------------+------------------------------------------+

| • Severe, widespread monsoon deficits.    | • Deficits are partially or fully offset.|
| • High risk of country-wide droughts.    | • Normal or near-normal overall rainfall.|
| • Extended, intense summer heatwaves.    | • Rain distribution remains erratic.     |
+------------------------------------------+------------------------------------------+
- The Balancing Act: When a strong El Niño coincides with a highly intense positive IOD, the IOD acts as a counterbalance. It injects rainfall back into the system, neutralizing the Pacific Ocean’s drying effect.
- The Current Status: Current data from the India Meteorological Department (IMD) shows that while El Niño conditions are strengthening in the Pacific, IOD indicators remain mostly neutral. If the IOD fails to shift into a strong positive phase later in the season, India will lose its natural shield and face a much weaker monsoon.
- The Historical Precedent: In past years like 1997, a massive “Godzilla” El Niño hit the planet, but a record-breaking positive IOD developed simultaneously, saving India from a catastrophic drought. Conversely, when the IOD remains neutral or negative during an El Niño year, severe droughts typically follow, as seen in 2002 and 2009.
What This Means for India’s Preparedness
Because the atmosphere is highly unpredictable, climate experts emphasize preparedness over panic. Even if a positive IOD develops later to balance total rainfall, the distribution of rain will likely be highly erratic.
Governments and farmers are currently being urged to prioritize aggressive water conservation, transition to drought-resistant crops, and carefully manage regional reservoir levels to insulate the agricultural sector from unexpected dry spells.