
A new global atlas captures humanity’s entire built environment—from megacities to remote villages.

From a digital vantage point in orbit, scientists have mapped every building on Earth—2.75 billion structures, all in 3D. Researchers at the Technical University of Munich (TUM) have unveiled the first high-resolution 3D map of all the world’s structures. Compiled from satellite imagery dating back to 2019, the atlas charts exactly where people live and how their buildings rise and spread across the continents.
“With 3D models, we see not only the footprint but also the volume of each building, enabling far more precise insights into living conditions,” said Prof. Xiaoxiang Zhu, who leads the Chair of Data Science in Earth Observation at TUM and headed the project.
A Planet of Buildings
The sheer scale of this undertaking is staggering. Previous global building maps captured roughly 1.7 billion structures. This new dataset pushes that count to 2.75 billion, offering a resolution thirty times finer than earlier efforts.
Each building appears as a 3-by-3-meter model. That is detailed enough to estimate its height, volume, and spatial relationship to its neighbors.
Global Building Atlas: an open global and complete dataset of building polygons, heights and LoD1 3D models
Abstract
We introduce GlobalBuildingAtlas, a publicly available dataset providing global and complete coverage of building polygons, heights and Level of Detail 1 (LoD1) 3D building models. This is the first open dataset to offer high quality, consistent, and complete building data in 2D and 3D form at the individual building level on a global scale. Towards this dataset, we developed machine learning-based pipelines to derive building polygons and heights (called GBA.Height) from global PlanetScope satellite data, respectively. Also a quality-based fusion strategy was employed to generate higher-quality polygons (called GBA.Polygon) based on existing open building polygons, including our own derived one. With more than 2.75 billion buildings worldwide, GBA.Polygon surpasses the most comprehensive database to date by more than 1 billion buildings. GBA.Height offers the most detailed and accurate global 3D building height maps to date, achieving a spatial resolution of 3 m × 3 m – 30 times finer than previous global products (90 m), enabling a high-resolution and reliable analysis of building volumes at both local and global scales. Finally, we generated a global LoD1 building model (called GBA.LoD1) from the resulting GBA.Polygon and GBA.Height. GBA.LoD1 represents the first complete global LoD1 building models, including 2.68 billion building instances with predicted heights, i.e., with a height completeness of more than 97 %, achieving RMSEs ranging from 1.5 to 8.9 m across different continents. With its height accuracy, comprehensive global coverage and rich spatial details, GlobalBuildingAtlas offers novel insights on the status quo of global buildings, which unlocks unprecedented geospatial analysis possibilities, as showcased by a better illustration of where people live and a more comprehensive monitoring of the progress on the 11th Sustainable Development Goal of the United Nations. In this project, we provide the level of detail 1 (LoD1) data of buildings across the globe.
A overview of the dataset is illustrated bellow:

Access to the Data
Web Feature Service (WFS)
A WFS is provided so that one can access the data using other websites or GIS softwares such as QGIS and ArcGIS.
Url: https://tubvsig-so2sat-vm1.srv.mwn.de/geoserver/ows?
Researchers create 3D catalog of 2.75 billion buildingsAll the world’s buildings available as 3D models for the first time
With the GlobalBuildingAtlas, a research team at the Technical University of Munich (TUM) has created the first high-resolution 3D map of all buildings worldwide. The open data provides a crucial basis for climate research and the implementation of the UN Sustainable Development Goals. They enable more precise models for urbanization, infrastructure and disaster management – and help to make cities around the world more inclusive and resilient. How many buildings are there on Earth – and what do they look like in 3D? The research team led by Prof. Xiaoxiang Zhu, holder of the Chair of Data Science in Earth Observation at TUM, has answered these fundamental questions in this project funded by an ERC Starting Grant. The GlobalBuildingAtlas comprises 2.75 billion building models, covering all structures captured in satellite imagery from the year 2019. This makes it the most comprehensive collection of its kind. For comparison: the largest previous global dataset contained about 1.7 billion buildings. The 3D models with a resolution of 3×3 meters are 30 times finer than data from comparable databases.
In addition, 97 percent (2.68 billion) of the buildings are provided as LoD1 3D models (Level of Detail 1). These are simplified three-dimensional representations that capture the basic shape and height of each building. While less detailed than higher LoD levels, they can be integrated at scale into computational models, forming a precise basis for analyses of urban structures, volume calculations, and infrastructure planning. Unlike previous datasets, GlobalBuildingAtlas includes buildings from regions often missing in global maps – such as Africa, South America, and rural areas.
New perspectives for sustainability and climate research
“3D building information provides a much more accurate picture of urbanization and poverty than traditional 2D maps,” explains Prof. Zhu. “With 3D models, we see not only the footprint but also the volume of each building, enabling far more precise insights into living conditions. We introduce a new global indicator: building volume per capita, the total building mass relative to population – a measure of housing and infrastructure that reveals social and economic disparities. This indicator supports sustainable urban development and helps cities become more inclusive and resilient.”
Open data for global challenges
The 3D building data from the GlobalBuildingAtlas provides a precise basis for planning and monitoring urban development, enabling cities to take targeted measures to create inclusive and equitable living conditions – for example, by planning additional housing or public facilities such as schools and health centers in densely populated, disadvantaged neighborhoods. At the same time, the data is crucial for climate adaptation: it improves models on topics such as energy demand and CO₂ emissions and supports the planning of green infrastructure. Disaster prevention also benefits, as risks from natural events such as floods or earthquakes can be assessed more quickly.
The data is already attracting a great deal of interest: The German Aerospace Center (DLR), for example, is examining the use of the GlobalBuildingAtlas as part of the “International Charter: Space and Major Disasters”.

Global Building Atlas: an open global and complete dataset of building polygons, heights and LoD1 3D models abstraction we introduce GlobalBuildingAtlas, a publicly available dataset providing global and complete coverage of building polygons, heights and Level of Detail 1 (LoD1) 3D building models. This is the first open dataset to offer high quality, consistent, and complete building data in 2D and 3D form at the individual building level on a global scale. Towards this dataset, we developed machine learning-based pipelines to derive building polygons and heights (called GBA.Height) from global PlanetScope satellite data, respectively. Also a quality-based fusion strategy was employed to generate higher-quality polygons (called GBA.Polygon) based on existing open building polygons, including our own derived one. With more than 2.75 billion buildings worldwide, GBA.Polygon surpasses the most comprehensive database to date by more than 1 billion buildings. GBA.Height offers the most detailed and accurate global 3D building height maps to date, achieving a spatial resolution of 3 m × 3 m – 30 times finer than previous global products (90 m), enabling a high-resolution and reliable analysis of building volumes at both local and global scales. Finally, we generated a global LoD1 building model (called GBA.LoD1) from the resulting GBA.Polygon and GBA.Height. GBA.LoD1 represents the first complete global LoD1 building models, including 2.68 billion building instances with predicted heights, i.e., with a height completeness of more than 97 %, achieving RMSEs ranging from 1.5 to 8.9 m across different continents. With its height accuracy, comprehensive global coverage and rich spatial details, GlobalBuildingAtlas offers novel insights on the status quo of global buildings, which unlocks unprecedented geospatial analysis possibilities, as showcased by a better illustration of where people live and a more comprehensive monitoring of the progress on the 11th Sustainable Development Goal of the United Nations.
A new global atlas captures humanity’s entire built environment—from megacities to remote villages.
From a digital vantage point in orbit, scientists have mapped every building on Earth—2.75 billion structures, all in 3D.
Researchers at the Technical University of Munich (TUM) have unveiled the first high-resolution 3D map of all the world’s structures. Compiled from satellite imagery dating back to 2019, the atlas charts exactly where people live and how their buildings rise and spread across the continents.
“With 3D models, we see not only the footprint but also the volume of each building, enabling far more precise insights into living conditions,” said Prof. Xiaoxiang Zhu, who leads the Chair of Data Science in Earth Observation at TUM and headed the project.
A Planet of Buildings
The sheer scale of this undertaking is staggering. Previous global building maps captured roughly 1.7 billion structures. This new dataset pushes that count to 2.75 billion, offering a resolution thirty times finer than earlier efforts.
Each building appears as a 3-by-3-meter model. That is detailed enough to estimate its height, volume, and spatial relationship to its neighbors.
Ninety-seven percent of the buildings are represented as Level of Detail 1 (LoD1) models—simplified three-dimensional forms that capture each structure’s geometry and elevation.
The project is open to the public. Anyone can explore it online, zooming from a continent-wide perspective down to a single neighborhood, even remote villages. Users can even enter a specific address to see a building’s location and elevation on the interactive map.

A Different Perspective
This map is essentially a new way to look at human activity, the researchers say.
Get smarter everyday…
Join 20,000+ curious minds who subscribe to ZME Science’s best stories.Sign Up
Don’t worry. You can unsubscribe anytime. Before signing up, review our .
Daily Newsletter
The science you need to know, every weekday.
Weekly Newsletter
A week in science, all in one place. Sends every Sunday. “3D building information provides a much more accurate picture of urbanization and poverty than traditional 2D maps,” Zhu said. “We introduce a new global indicator: building volume per capita, the total building mass relative to population—a measure of housing and infrastructure that reveals social and economic disparities.”
The metric could reshape how researchers track inequality. Wealthier areas tend to have larger volumes of buildings per person, spacious homes, wider streets, taller structures. On the other hand, densely populated, low-income regions often show the opposite. This ratio, mapped across countries, provides a visual measure of economic development and living standards.
Governments and humanitarian organizations can identify where housing shortages are most acute, where public services are strained, or where informal settlements expand fastest. “The 3D building data from the GlobalBuildingAtlas provides a precise basis for planning and monitoring urban development,” Zhu said. “It enables cities to take targeted measures to create inclusive and equitable living conditions.”
Closing the Data Gap
For decades, global building datasets leaned heavily toward wealthy nations. Satellite images from Europe, North America, and East Asia were abundant. Meanwhile, data from Africa, South America, and Southeast Asia remained sparse or unreliable.
The TUM team made inclusion a priority. Their algorithms filled gaps across rural and previously under-mapped regions, correcting biases that have long plagued Earth-observation data. The result is a truly global picture—from the towers of Manhattan to the farmhouses of Kenya.
That coverage could transform development planning in the Global South. Urban expansion can now be monitored with unprecedented granularity, enabling early interventions before infrastructure strains or informal settlements become entrenched. Beyond urban studies, the dataset has immediate implications for the planet’s changing climate. Buildings account for nearly 40% of global CO₂ emissions. Knowing their height, density, and distribution can sharpen models of energy demand and greenhouse-gas output.
Data Driven Decisions
The GlobalBuildingAtlas arrives at a moment when humanity’s footprint is expanding faster than ever. By 2050, nearly seven in ten people will live in cities. For scientists and policymakers racing to adapt to that growth, the atlas reflects what has been built and points toward what must come next. It also empowers open science. Development Code
Global Building Polygon Generation using Satellite Data (Sec. 4.3)
For codes related to building map extraction, regularization, polygonization, and simplification, i.e., generating building polygons from satellite images (Sec. 4.3.2, Sec. 4.3.3, and Sec. 4.3.4), please refer to ./im2bf.
Global Building Height Estimation (Sec. 4.4)
- For codes related to monocular height estimation using HTC-DC Net (Sec. 4.4.2), please refer to
./im2bh. - For codes related to the global inference and uncertainty quantification (Sec. 4.4.3), please refer to
./infer_height
Global LoD1 Building Model Generation (Sec. 4.5)
- For codes related to quality-guided building polygon fusion (Sec. 4.5.1), please refer to
./fuse_bf. - For codes related to LoD1 building model generation (Sec. 4.5.2), please refer to
./make_lod1.
Visualization Code
For codes to reproduce the plots in the manuscript, please refer to ./make_plots.
How to cite
If you find this dataset helpful in your work, please cite the following paper.
@Article{essd-17-6647-2025, AUTHOR = {Zhu, X. X. and Chen, S. and Zhang, F. and Shi, Y. and Wang, Y.}, TITLE = {GlobalBuildingAtlas: an open global and complete dataset of building polygons, heights and LoD1 3D models}, JOURNAL = {Earth System Science Data}, VOLUME = {17}, YEAR = {2025}, NUMBER = {12}, PAGES = {6647–6668}, URL = {https://essd.copernicus.org/articles/17/6647/2025/}, DOI = {10.5194/essd-17-6647-2025} }
For Zhu, the work is just beginning. The next steps involve integrating temporal data to show how the built environment changes over time—how cities rise, sprawl, or decay.
Key Details of the GlobalBuildingAtlas
Data Type Most buildings (97%) are provided as Level of Detail 1 (LoD1) models, which are simplified 3D representations that capture basic shape and height for use in large-scale computational models.
Resolution The map provides a high spatial resolution of 3×3 meters for each structure, allowing for detailed analysis of urban landscapes.
Coverage Unlike prior datasets that often missed data from rural areas, Africa, and South America, this atlas provides consistent global coverage.
Applications
The new open data resource is expected to have significant implications across various fields: News
GlobalBuildingAtlas: World’s First High-Resolution 3D Map of All Buildings Released
04.12.2025
Our team has released the world’s first high-resolution 3D map of all buildings, comprising 2.75 billion structures worldwide.
Our research team has released the GlobalBuildingAtlas, the first-ever high-resolution 3D map of all 2.75 billion buildings worldwide. Developed under an ERC Starting Grant, this dataset represents a milestone for global Earth observation, sustainability studies, and geospatial AI.
The GlobalBuildingAtlas provides 3D building models at 3×3 m resolution, including 2.68 billion LoD1 representations capturing building shape and height. For the first time, comprehensive 3D building information is available globally – including regions previously underrepresented in global datasets, such as Africa, South America, and rural areas.
These data form a new basis for climate research, energy modeling, sustainable urban development, infrastructure planning, and disaster management. The dataset also introduces a novel global indicator, building volume per capita, offering new insights into socio-economic inequalities and urban resilience.
The work is already receiving strong international interest; for example, DLR is exploring its use through the International Charter: Space and Major Disasters.
Urban Planning It offers a more precise understanding of urban structures and living conditions, helping to design more sustainable and resilient cities.
Climate Research The detailed building volume data can be used for advanced climate modeling and energy use estimations.
Disaster Management Emergency teams can use the map to better estimate damage risks and plan responses to natural disasters.
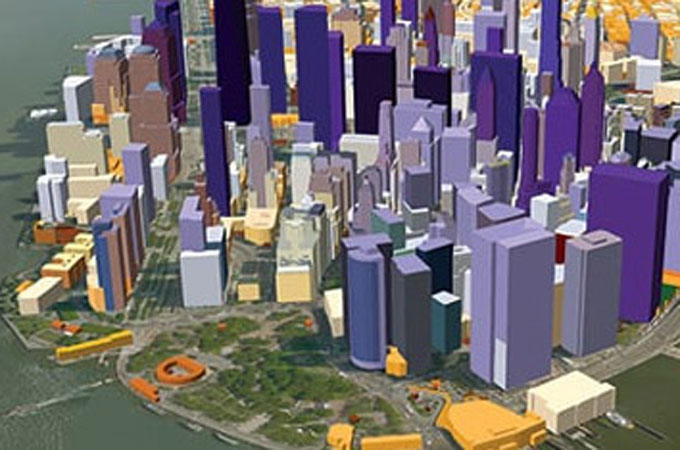
Scientists in Germany have, for the first time, produced the most comprehensive digital representation of the world’s built environment by compiling a high-resolution, three-dimensional dataset containing 2.75 billion buildings.
TheGlobalBuildingAtlas, developed by a research team at the Technical University of Munich (TUM), provides a foundation for advanced climate studies and supports the implementation of the UN Sustainable Development Goals.
XiaoxiangZhu, PhD, a professor and holder of the Chair of Data Science in Earth Observation at TUM, who led the project, said the map is expected to enhance the accuracy ofurbanisation, disaster management and infrastructure models, helping cities become more inclusive and resilient.
She explained that three-dimensional building data reveals patterns ofurbanisationand poverty far more accurately than two-dimensional maps. “With 3D models, we see not only the footprint but also the volume of each building, enabling far more precise insights into living conditions,” she stated.
Zhu noted that the map introduces a new metric called building volume per capita, a global indicator that measures total building mass per individual and highlights social and economic disparities. “This indicator supports sustainable urban development and helps cities become more inclusive and resilient,” she added.
The three-dimensional building data is expected to provide a precise basis for planning and monitoring urban development. It is also intended to help cities take targeted measures to create more inclusive and equitable living conditions, including the provision of additional housing or public facilities in densely populated, underserved areas.
The map is also considered vital for climate adaptation, as it improves models of energy demand, CO2 emissions and green infrastructure planning.
In addition, it strengthens disaster-prevention efforts by enabling quicker assessments of risks posed by natural events. Global Building Atlas Polygons
GlobalBuildingAtlas is a comprehensive dataset providing global coverage of building polygons (GBA.Polygon), heights (GBA.Height), and Level of Detail 1 (LoD1) 3D building models (GBA.LoD1). This represents the first open dataset to offer high quality, consistent, and complete building data in both 2D and 3D forms at the individual building level on a global scale. The dataset was developed using machine learning-based pipelines applied to global PlanetScope satellite imagery, offering unprecedented spatial resolution and coverage for building-level analysis.
The GlobalBuildingAtlas addresses critical gaps in existing global building datasets by providing comprehensive 3D information at individual building level, which enables applications in urban planning, energy modeling, disaster risk assessment, and climate change research. With more than 2.75 billion building polygons worldwide, this dataset surpasses existing global building databases by over 1 billion structures.
Dataset Details
| Characteristic | Description |
|---|---|
| Name | GlobalBuildingAtlas – Global Building Polygons, Heights and LoD1 3D Models |
| Provider | Technical University of Munich (TUM) |
| Coverage | Global (2.75 billion building polygons) |
| Temporal Range | 2019 (primary reference year) |
| Resolution | 3×3 meters (height maps), Individual building polygons |
| Data Format | GeoJSON (polygons/3D models), GeoTIFF (height maps) |
| Coordinate System | WGS84 (EPSG:4326) |
| Source Data | PlanetScope Surface Reflectance imagery + Multiple building footprint sources |
Citation
Zhu, Xiao Xiang, Sining Chen, Fahong Zhang, Yilei Shi, and Yuanyuan Wang. "GlobalBuildingAtlas: An Open Global and Complete Dataset of Building Polygons,
Heights and LoD1 3D Models." arXiv preprint arXiv:2506.04106 (2025).
Dataset Citation
Zhu, X.X., Chen, S., Zhang, F., Shi, Y., Wang, Y. (2025). GlobalBuildingAtlas: An Open Global and Complete Dataset of Building Polygons, Heights and LoD1 3D Models.
Technical University of Munich (TUM). [doi: 10.14459/2025mp1782307](https://doi.org/10.14459/2025mp1782307)
Coverage and Accuracy
Global Statistics: – Total Buildings: 2.75 billion polygons – With Height Data: 2.68 billion (97.4% completeness) – Total Building Area: 506.64 billion m² – Total Building Volume: 2.85 trillion m³
Data Availability in Earth Engine
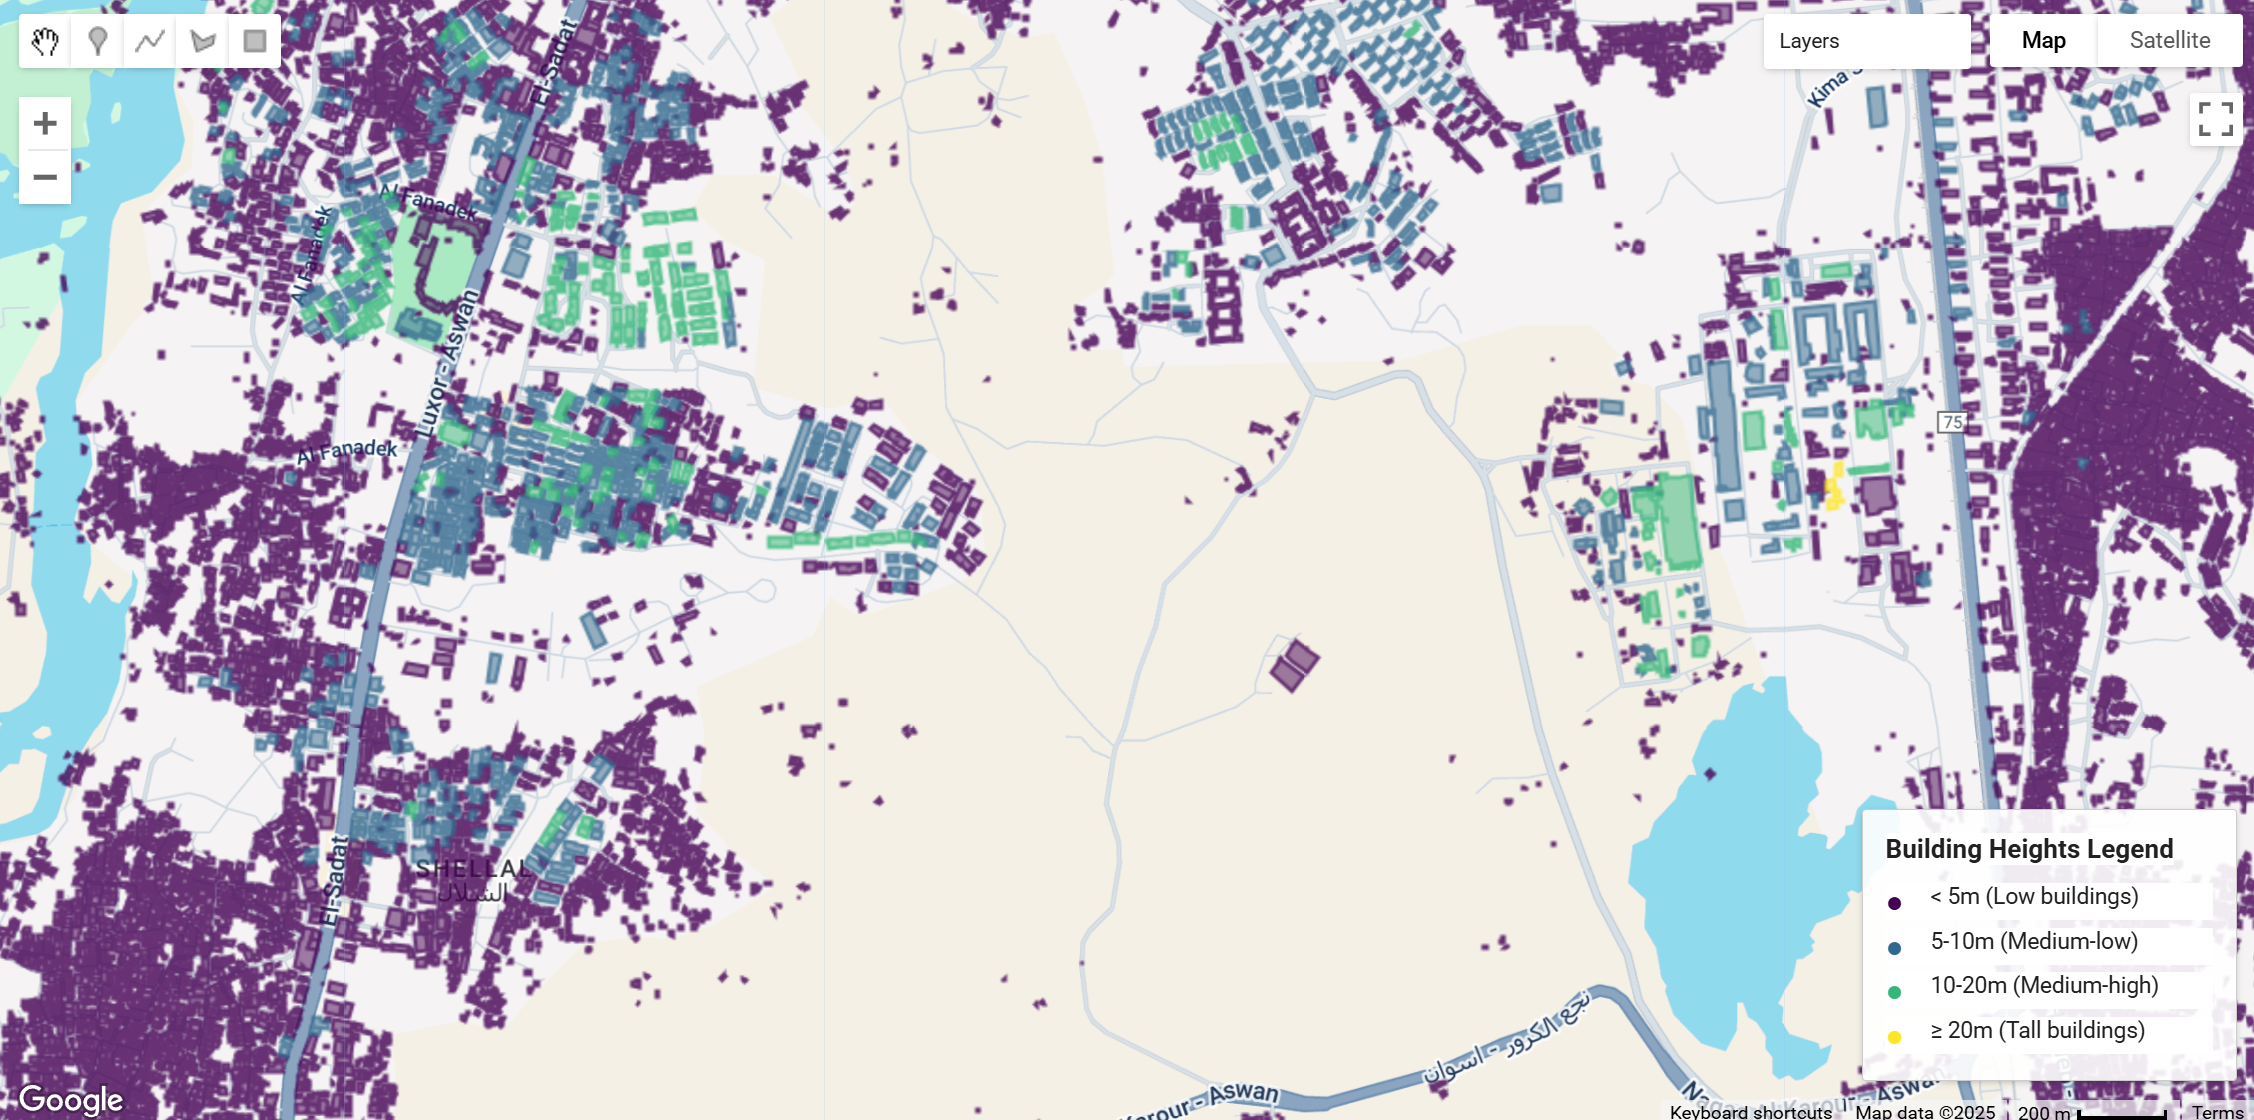
Only the GBA.Polygon component (building footprints with height attributes) is available in Google Earth Engine as Feature Collections. The GBA.Height raster maps and GBA.LoD1 3D models are available through the original data repository but not ingested into Earth Engine.
Earth Engine Snippet
// Load sample building polygon data – replace ‘TILE_ID’ with specific tile identifier var gba_polygons = ee.FeatureCollection(“projects/sat-io/open-datasets/GLOBAL_BUILDING_ATLAS/e030_n25_e035_n20”); // Filter buildings with height information var buildings_with_height = gba_polygons.filter( ee.Filter.and( ee.Filter.neq(‘height’, null), ee.Filter.gt(‘height’, 0) ) ); // Method 1: Color by height ranges using separate layers (more precise control) var heightRanges = [ {min: 0, max: 5, color: ‘440154’, label: ‘< 5m (Low)’}, {min: 5, max: 10, color: ‘31688e’, label: ‘5-10m (Medium-low)’}, {min: 10, max: 20, color: ’35b779′, label: ’10-20m (Medium-high)’}, {min: 20, max: 999, color: ‘fde725’, label: ‘≥ 20m (Tall)’} ]; // Add layers for each height range heightRanges.forEach(function(range) { var rangeFilter = ee.Filter.and( ee.Filter.gte(‘height’, range.min), ee.Filter.lt(‘height’, range.max) ); var rangeBuildings = buildings_with_height.filter(rangeFilter); Map.addLayer( rangeBuildings, {color: range.color, width: 1, fillColor: range.color}, ‘Height ‘ + range.label, true, 0.8 ); }); // Calculate building statistics print(‘Total building polygons in tile:’, gba_polygons.size()); print(‘Buildings with height data:’, buildings_with_height.size()); // Filter large buildings by area and use simple style var large_buildings = gba_polygons.filter(ee.Filter.gt(‘area’, 500)); Map.addLayer(large_buildings.style({color: ‘red’}), {}, ‘Large Buildings (>500m²)’); // Get height statistics var height_stats = buildings_with_height.aggregate_stats(‘height’); print(‘Height statistics:’, height_stats); // Create height legend panel function createLegendRow(color, text) { return ui.Panel({ widgets: [ ui.Label({ value: ‘●’, style: { color: color, fontSize: ’16px’, margin: ‘0px 8px 0px 0px’, padding: ‘0px’, width: ’16px’, textAlign: ‘left’ } }), ui.Label({ value: text, style: { fontSize: ’12px’, margin: ‘0px’, padding: ‘0px’ } }) ], layout: ui.Panel.Layout.flow(‘horizontal’), style: { margin: ‘2px 0px’, padding: ‘0px’ } }); } var legendPanel = ui.Panel({ widgets: [ ui.Label({ value: ‘Building Heights Legend’, style: {fontWeight: ‘bold’, fontSize: ’14px’, margin: ‘0 0 8px 0’} }), createLegendRow(‘#440154’, ‘< 5m (Low buildings)’), createLegendRow(‘#31688e’, ‘5-10m (Medium-low)’), createLegendRow(‘#35b779′, ’10-20m (Medium-high)’), createLegendRow(‘#fde725’, ‘≥ 20m (Tall buildings)’) ], style: { position: ‘bottom-right’, padding: ’12px’, backgroundColor: ‘rgba(255, 255, 255, 0.9)’, border: ‘1px solid #ccc’, width: ‘200px’ } }); Map.add(legendPanel); // Center map on the tile extent Map.setCenter(32.90,24.06, 15);
